. 2013 Dec 11;8(12):e82433.
doi: 10.1371/journal.pone.0082433. eCollection 2013.

Succession of ephemeral secondary forests and their limited role for the conservation of floristic diversity in a human-modified tropical landscape

Affiliations

Succession of ephemeral secondary forests and their limited role for the conservation of floristic diversity in a human-modified tropical landscape

Michiel van Breugel et al. PLoS One. .

Abstract

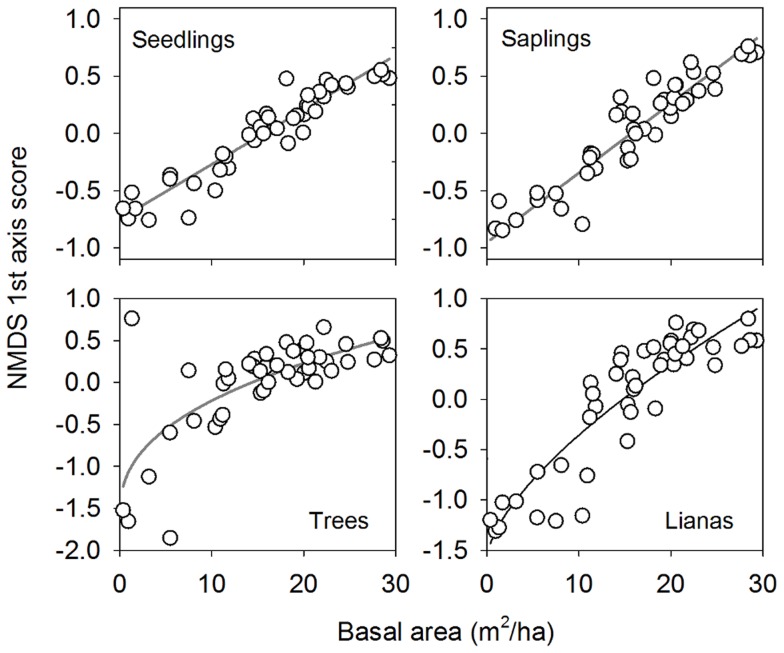
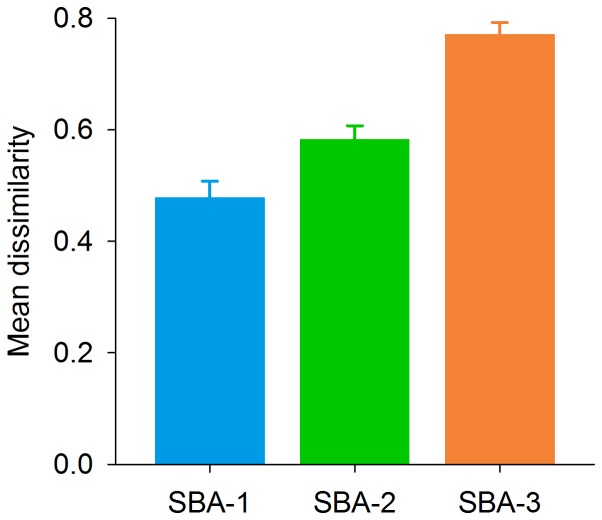
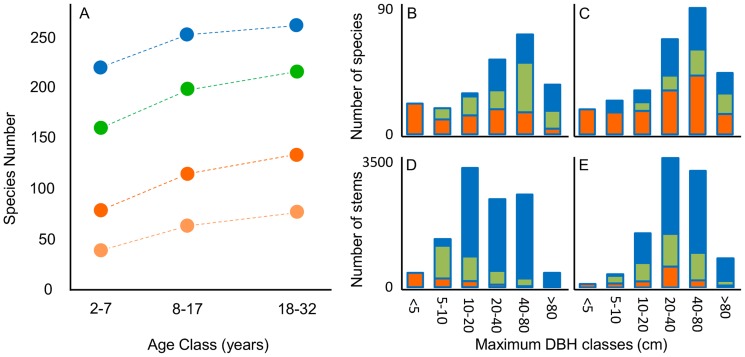
Both local- and landscape-scale processes drive succession of secondary forests in human-modified tropical landscapes. Nonetheless, until recently successional changes in composition and diversity have been predominantly studied at the patch level. Here, we used a unique dataset with 45 randomly selected sites across a mixed-use tropical landscape in central Panama to study forest succession simultaneously on local and landscape scales and across both life stages (seedling, sapling, juvenile and adult trees) and life forms (shrubs, trees, lianas, and palms). To understand the potential of these secondary forests to conserve tree species diversity, we also evaluated the diversity of species that can persist as viable metapopulations in a dynamic patchwork of short-lived successional forests, using different assumptions about the average relative size at reproductive maturity. We found a deterministic shift in the diversity and composition of the local plant communities as well as the metacommunity, driven by variation in the rate at which species recruited into and disappeared from the secondary forests across the landscape. Our results indicate that dispersal limitation and the successional niche operate simultaneously and shape successional dynamics of the metacommunity of these early secondary forests. A high diversity of plant species across the metacommunity of early secondary forests shows a potential for restoration of diverse forests through natural succession, when trees and fragments of older forests are maintained in the agricultural matrix and land is abandoned or set aside for a long period of time. On the other hand, during the first 32 years the number of species with mature-sized individuals was a relatively small and strongly biased sub-sample of the total species pool. This implies that ephemeral secondary forests have a limited role in the long-term conservation of tree species diversity in human-modified tropical landscapes.


Conflict of interest statement

Competing Interests: The study received funding from the HSBC climate partnership. There are no patents, products in development or marketed products to declare. This does not alter the authors' adherence to all the PLOS ONE policies on sharing data and materials.

Figures

Figure 1
Figure 1. The Agua Salud landscape and its secondary forests.
A) An aerial overview of part of the Agua Salud landscape, with a mosaic dominated by secondary forests of different ages and pastures. Note the isolated trees and live fences in the pastures and the strips of forest along the streams. Photo printed under a CC BY license with permission from Christian Ziegler. B) Predictable changes in stand and canopy structure of secondary forests during succession, but with substantial variation among similar aged sites. Light  =  the average light availability in the understory as a percentage of above-canopy values and was calculated from 11 hemispherical photographs per plot. Blue, green and orange colors indicate SFD plots with stand basal areas of 0-11, 11-20, 20-30, and >30 m2 ha−1, respectively. See Fig. S1 for the distribution of the SFD plots across the landscape.
Figure 2
Figure 2. Compositional change with successional stand development.
Variation in species composition was assessed for four different groups of woody plants by calculating the relative positions of sites along the axes of a non-metric multidimensional scaling (NMDS) ordination, based on the Jaccard abundance-based dissimilarity index. See methods for definition of plant groups and sample areas. Equation type and regression statistics are provided in Table 2.
Figure 3
Figure 3. Increasing dissimilarity between seedling and the initial assemblages of trees.
Mean of pair-wise dissimilarities between the seedling assemblages of SBA classes 1, 2 and 3 with the assemblages of plants ≥ 1 cm DBH of SBA class 1, using the Chao Jaccard Abundance Estimator. Error bars indicate ± 95% confidence limits. Calculations included only species that can potentially grow to a diameter of at least 5 cm.
Figure 4
Figure 4. Changes in diversity with successional stand development on local and landscape scale.
Indices of species diversity were calculated for four different groups of woody plants, and for individual sites (white dots and regression lines) and the metacommunity (diamonds and triangles). A-D) 0 D  =  species density. E-H) 1 D  =  the exponential of Shannon entropy. I-L), 2 D  =  the inverse Simpson concentration. For all three diversity measures, units are in number of species. Metacommunity diversity was calculated for the pooled data of randomized samples of 12 SFD sites. Colors indicate SBA classes as in figure 1 and error bars give the 95% confidence limits. The lines connecting the symbols are for illustrative purposes only. Sample area per plot and per SBA class is indicated above the graphs. Equation type and regression statistics are given in Table 2.
Figure 5
Figure 5. Frequency of occurrence in stand basal area (SBA) classes.
Frequency is calculated as the percentage of the plots in which a species occurred with individuals ≥ 1 cm diameter. Species include trees, shrub, palm and lianas. A) A scatter plot of frequencies in SBA class 1 and 3. Open circles give frequencies with ≥ 1 individual (F1) and yellow dots give frequencies with ≥ 5% of total number of individuals (F5%). The size of the circle indicates the number of species with the indicated frequencies (indicated range: from 1 to ≥ 10 species, true range: 1–75 species). Frequencies of species that occurred in one of the SBA classes, but not the other, are plotted to the left or below the null axes. B) Rank-frequency curves, colors indicate SBA-1 (blue), SBA-2 (green) and SBA-3 (orange).
Figure 6
Figure 6. Diversity in relationship with relative size and forest age.
A) Number of tree and shrub species per age class (lianas and palms not included!), when all individuals are taken into account (blue dots), when only individuals above the relative size threshold (RST) of 10% (green dots) or of 30% (darker orange dots) are counted and when only species are counted with individuals ≥ RST30% in more than one plot (lighter orange dots). Per age class, species were counted for the pooled data of 15 SFD plots (3 ha). Dotted lines are for illustrative purposes. B-C) Number of species per maximum-size class (blue) and the subsamples of species with individuals above relative size thresholds of 10% (green) and 30% (orange). D-E) Number of stems per maximum size class. Graphs show data for the 2–7 y age class (B, D) and the 18–32 y age class (C, E).

References

    1. International Tropical Timber Organization (2002) ITTO guidelines for the restoration, management and rehabilitation of degraded and secondary tropical forests. Yokohama, Japan: International Tropical Timber Organization. 84 p. Available: http://www.itto.int/policypapers_guidelines/. Accessed 15 January 2013.
    1. Food and Agricultural Organization (2011) State of the World’s Forests. Rome: Food and Agriculture Organization of the United Nations. 164 p. Available: http://www.fao.org/docrep/013/i2000e/i2000e00.htm. Accessed 20 January 2013.
    1. Asner GP, Rudel TK, Aide TM, Defries R, Emerson R (2009) A contemporary assessment of change in humid tropical forests. Conserv Biol 23: 1386–1395. - PubMed
    1. Chazdon Robin RL, Peres CA, Dent DH, Sheil D, Lugo AE, et al. (2009) The Potential for Species Conservation in Tropical Secondary Forests. Conserv Biol 23: 1406–1417. - PubMed
    1. Harvey CA, Komar O, Chazdon R, Ferguson BG, Finegan B, et al. (2008) Integrating agricultural landscapes with biodiversity conservation in the Mesoamerican hotspot. Conserv Biol 22: 8–15. - PubMed

Publication types

LinkOut - more resources