

Effects of remifemin treatment on bone integrity and remodeling in rats with ovariectomy-induced osteoporosis
- PMID: 24349369
- PMCID: PMC3857312
- DOI: 10.1371/journal.pone.0082815
Effects of remifemin treatment on bone integrity and remodeling in rats with ovariectomy-induced osteoporosis
Abstract
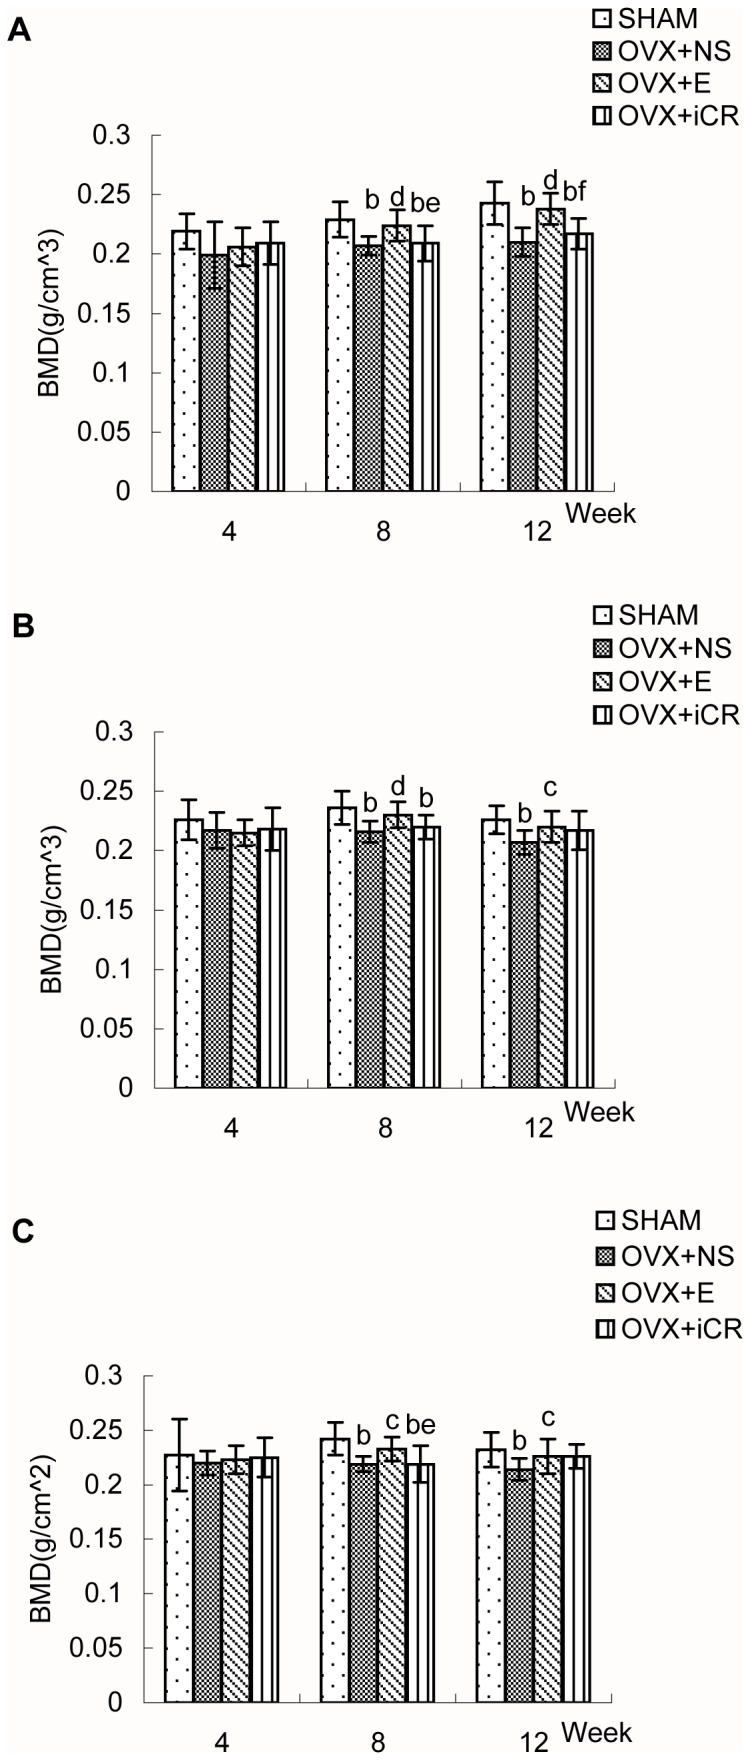
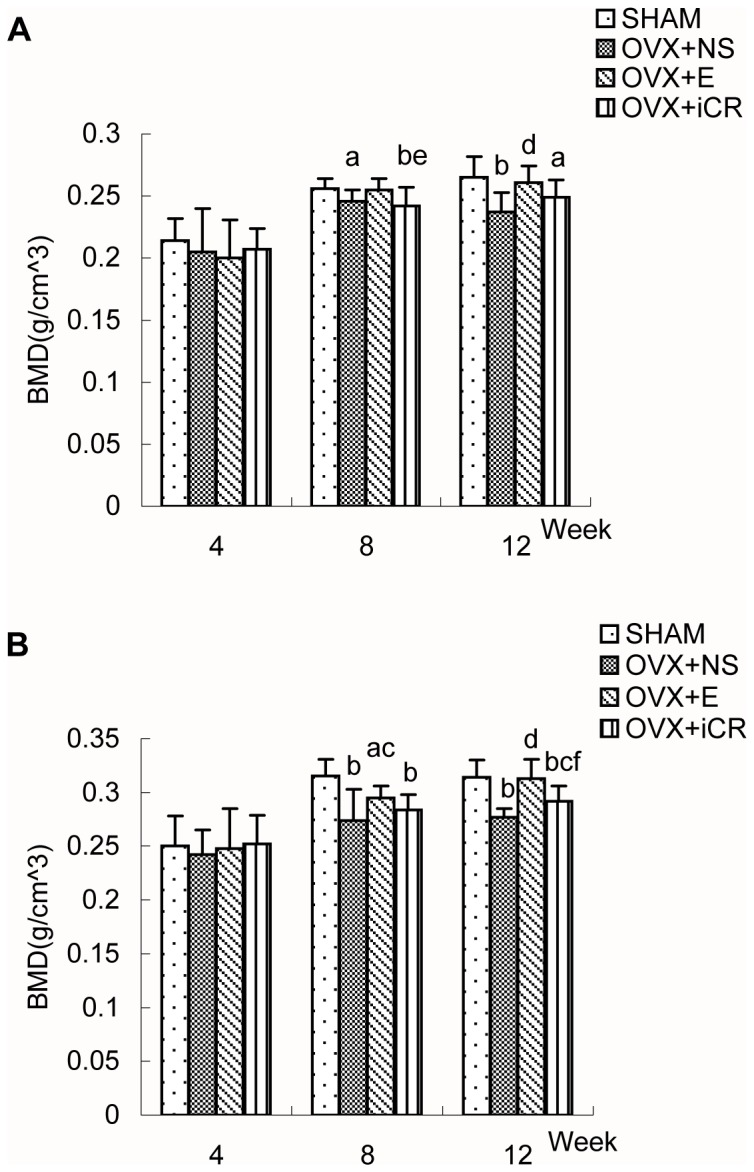
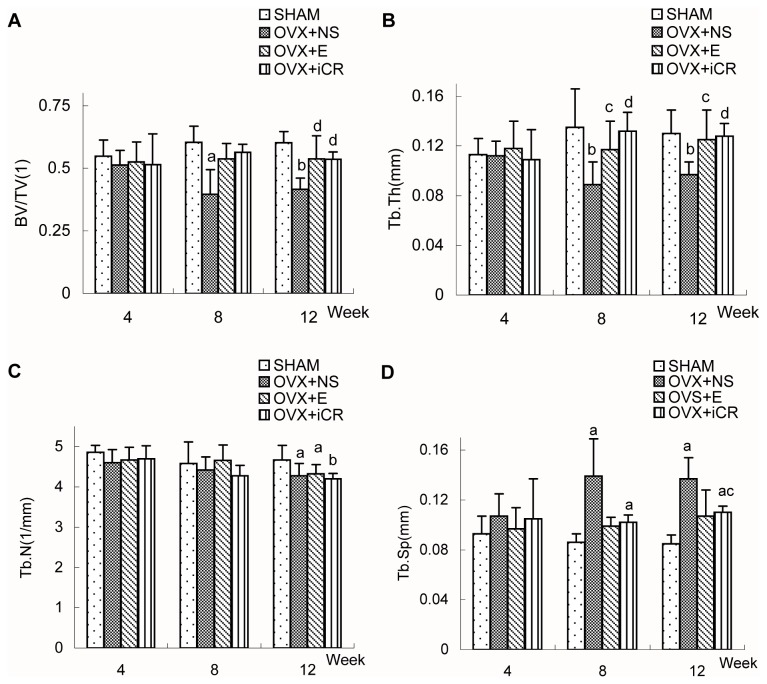
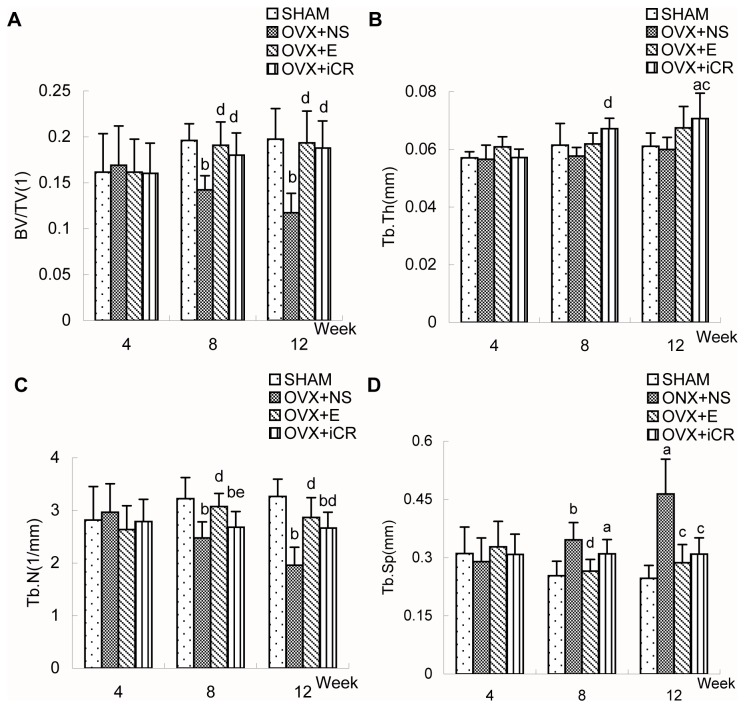
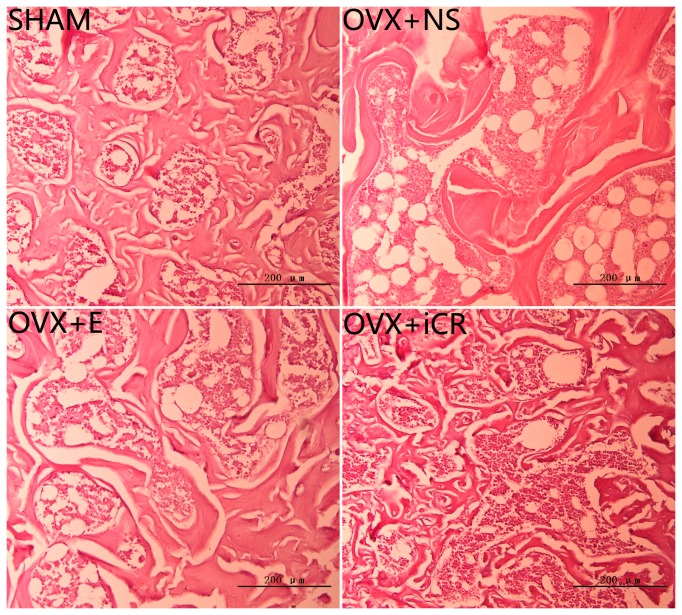
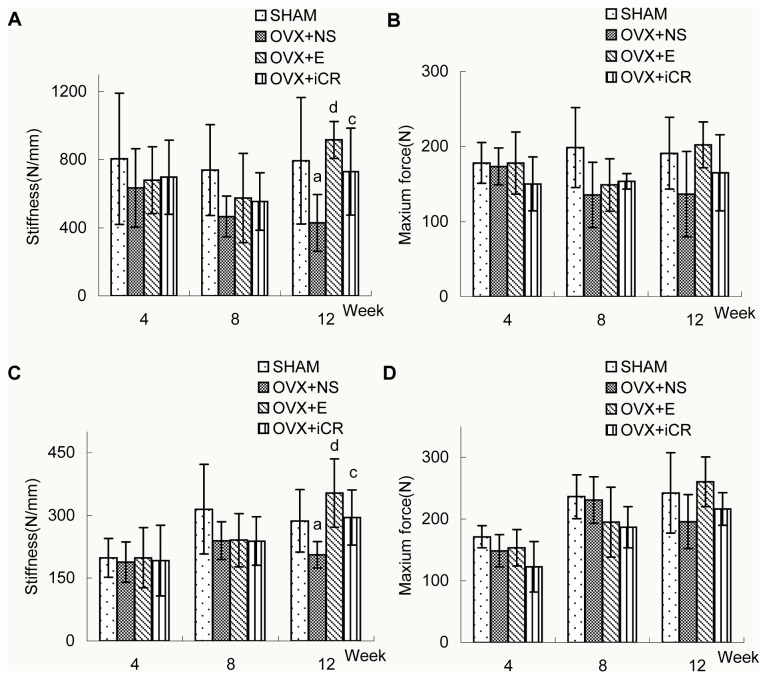
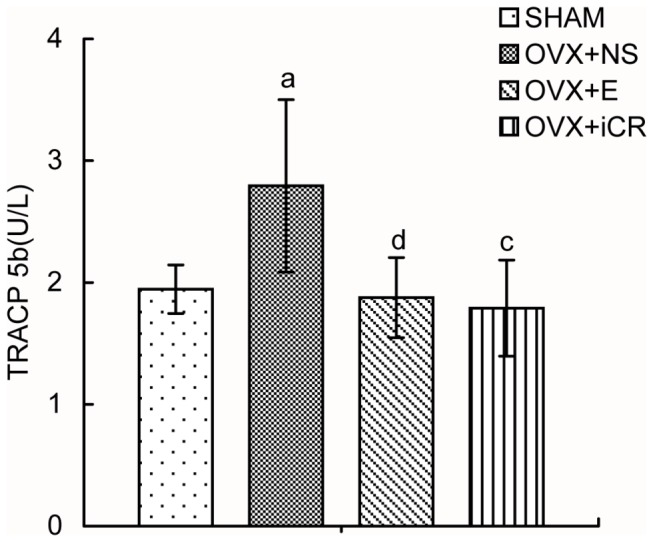
This study aims to evaluate the effects of Remifemin (isopropanolic extract of Cimicifuga Racemosa) on postmenopausal osteoporosis. 120 female Sprague-Dawley rats were randomly assigned to four groups: sham surgery with vehicle, ovariectomy with vehicle, ovariectomy with estradiol valerate, or ovariectomy with Remifemin. Daily oral administrations of the vehicle, estradiol valerate, or Remifemin began 2 weeks after surgery and lasted to 4, 8, or 12 weeks. Ten rats in each group were sacrificed at each timestep with assessment of bone mineral density, trabecular bone structure, and biomechanical parameters of the femur and lumbar vertebra. Bone turnover markers were evaluated 12 weeks after surgery. Both drugs prevented bone density loss in the distal end of the femur and preserved the trabecular bone structure in both the lumbar vertebra and distal end of the femur following ovariectomy. Both drugs protected bone stiffness at the tested regions and reduced bone reabsorption in ovariectomized rats. The preventive effects of Remifemin against bone-loss can rival those of estradiol valerate if treatment duration is adequately extended. In conclusion, Remifemin may demonstrate equivalent effects to estradiol valerate in terms of preventing postmenopausal osteoporosis.
Conflict of interest statement
Figures
Similar articles
-
Effects of an isopropanolic extract of Cimicifuga racemosa on urinary crosslinks and other parameters of bone quality in an ovariectomized rat model of osteoporosis.J Bone Miner Metab. 2003;21(6):370-6. doi: 10.1007/s00774-003-0431-9. J Bone Miner Metab. 2003. PMID: 14586793
-
Estradiol Valerate and Remifemin ameliorate ovariectomy-induced decrease in a serotonin dorsal raphe-preoptic hypothalamus pathway in rats.Ann Anat. 2016 Nov;208:31-39. doi: 10.1016/j.aanat.2016.08.001. Epub 2016 Aug 22. Ann Anat. 2016. PMID: 27562857
-
Anti-osteoporosis activity of Cibotium barometz extract on ovariectomy-induced bone loss in rats.J Ethnopharmacol. 2011 Oct 11;137(3):1083-8. doi: 10.1016/j.jep.2011.07.017. Epub 2011 Jul 18. J Ethnopharmacol. 2011. PMID: 21782010
-
A traditional Chinese herbal preparation, Er-Zhi-Wan, prevent ovariectomy-induced osteoporosis in rats.J Ethnopharmacol. 2011 Nov 18;138(2):279-85. doi: 10.1016/j.jep.2011.09.030. Epub 2011 Oct 5. J Ethnopharmacol. 2011. PMID: 22001072 Review.
-
Rabbit as model for osteoporosis research.J Bone Miner Metab. 2019 Jul;37(4):573-583. doi: 10.1007/s00774-019-01007-x. Epub 2019 May 13. J Bone Miner Metab. 2019. PMID: 31087186 Review.
Cited by
-
Herbal Products Used in Menopause and for Gynecological Disorders.Molecules. 2021 Dec 8;26(24):7421. doi: 10.3390/molecules26247421. Molecules. 2021. PMID: 34946512 Free PMC article. Review.
-
Differential Regulation of Morphology and Estrogen Receptor-Alpha Expression in the Vagina of Ovariectomized Adult Virgin Rats by Estrogen Replacement: A Histological Study.Int J Endocrinol. 2016;2016:1093512. doi: 10.1155/2016/1093512. Epub 2016 Aug 24. Int J Endocrinol. 2016. PMID: 27642295 Free PMC article.
-
Protective effect of Glycyrrhiza glabra roots extract on bone mineral density of ovariectomized rats.Biomedicine (Taipei). 2019 Jun;9(2):8. doi: 10.1051/bmdcn/2019090208. Epub 2019 May 24. Biomedicine (Taipei). 2019. PMID: 31124454 Free PMC article.
-
Metabolomics and physiological analysis of the effect of calcium supplements on reducing bone loss in ovariectomized rats by increasing estradiol levels.Nutr Metab (Lond). 2021 Jul 23;18(1):76. doi: 10.1186/s12986-021-00602-y. Nutr Metab (Lond). 2021. PMID: 34301294 Free PMC article.
-
Lycopene prevents bone loss in ovariectomized rats and increases the number of osteocytes and osteoblasts.J Anat. 2022 Sep;241(3):729-740. doi: 10.1111/joa.13672. Epub 2022 Apr 20. J Anat. 2022. PMID: 35445391 Free PMC article.
References
Publication types
MeSH terms
Substances
LinkOut - more resources
Full Text Sources
Other Literature Sources
Medical
