

Evaluating the impact of different sequence databases on metaproteome analysis: insights from a lab-assembled microbial mixture
- PMID: 24349410
- PMCID: PMC3857319
- DOI: 10.1371/journal.pone.0082981
Evaluating the impact of different sequence databases on metaproteome analysis: insights from a lab-assembled microbial mixture
Abstract
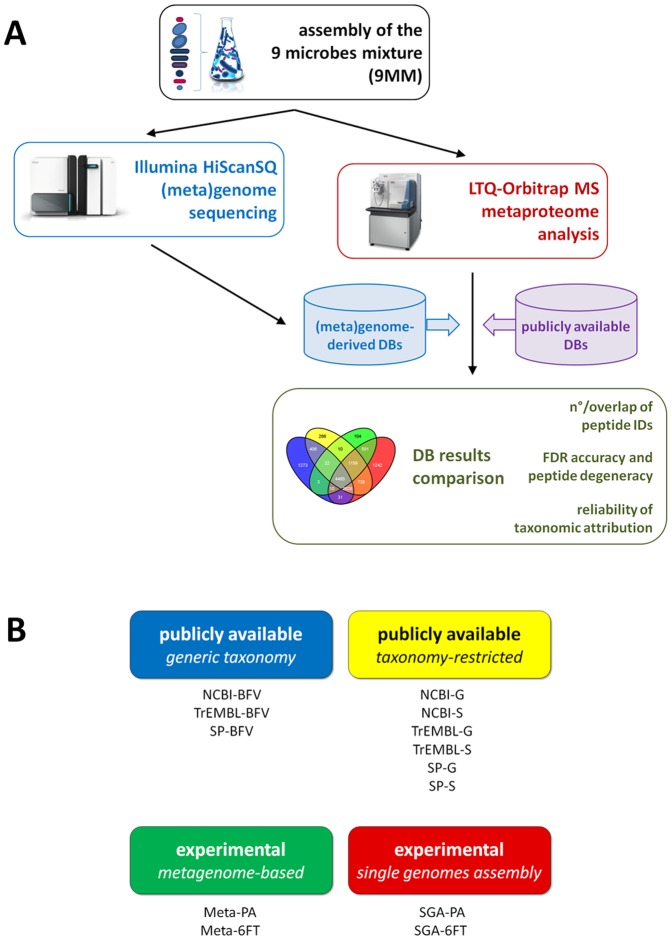
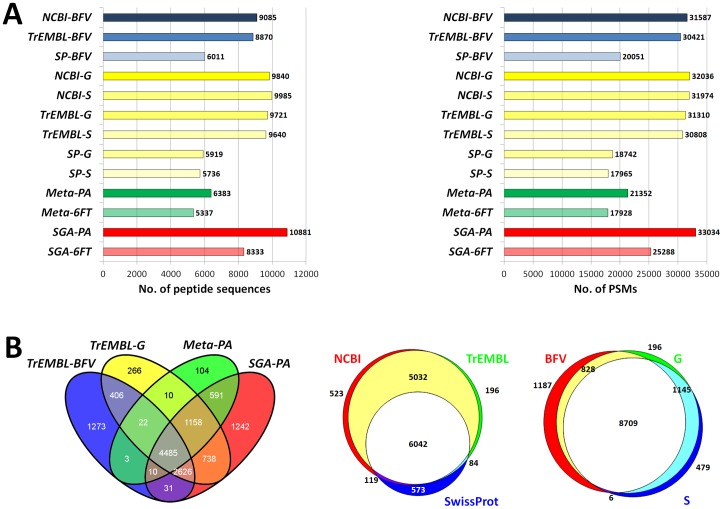
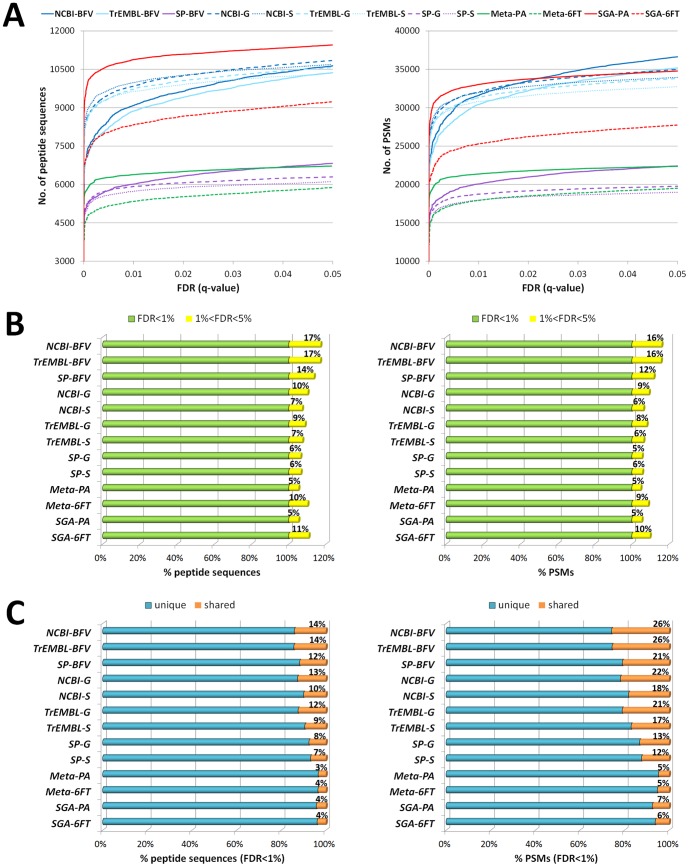
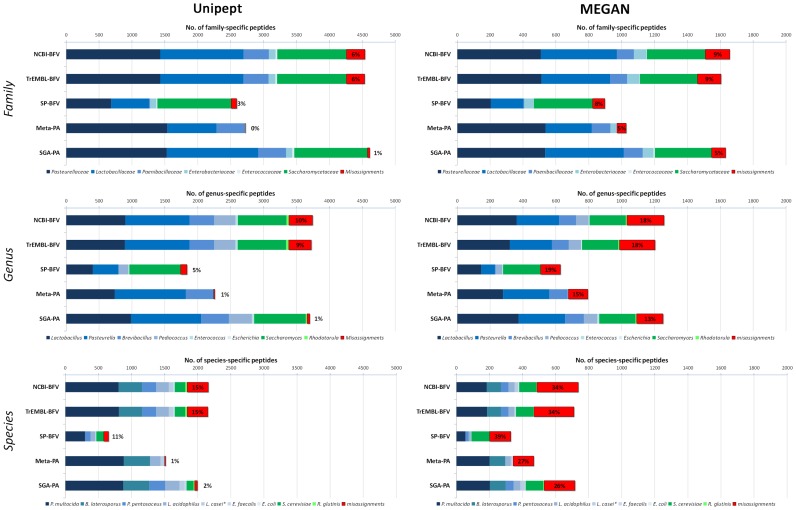
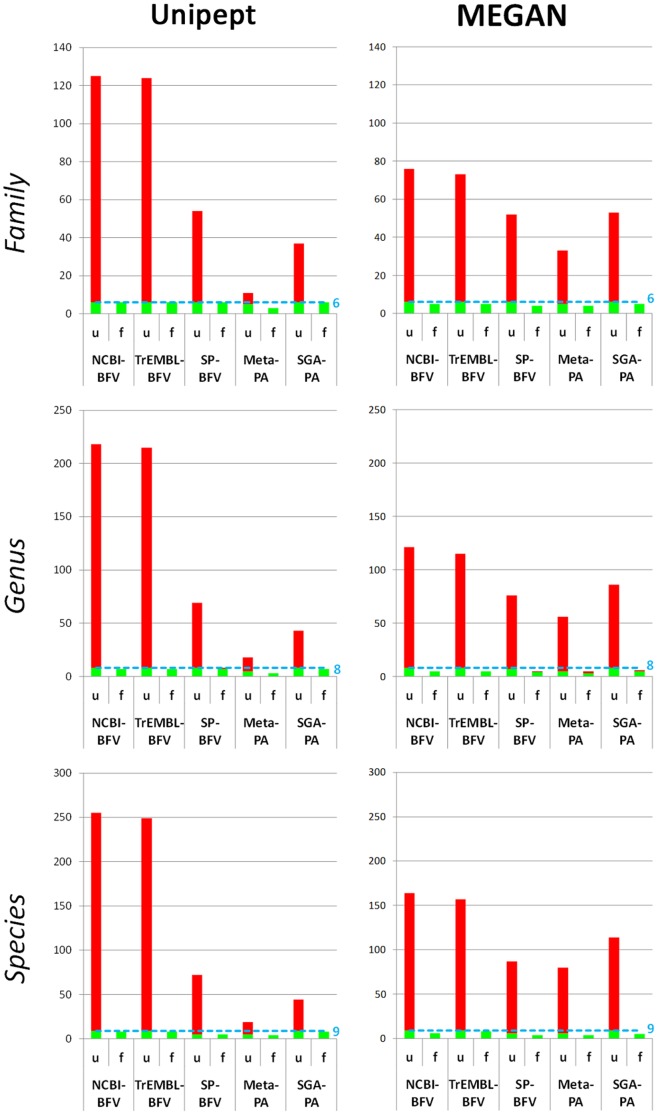
Metaproteomics enables the investigation of the protein repertoire expressed by complex microbial communities. However, to unleash its full potential, refinements in bioinformatic approaches for data analysis are still needed. In this context, sequence databases selection represents a major challenge. This work assessed the impact of different databases in metaproteomic investigations by using a mock microbial mixture including nine diverse bacterial and eukaryotic species, which was subjected to shotgun metaproteomic analysis. Then, both the microbial mixture and the single microorganisms were subjected to next generation sequencing to obtain experimental metagenomic- and genomic-derived databases, which were used along with public databases (namely, NCBI, UniProtKB/SwissProt and UniProtKB/TrEMBL, parsed at different taxonomic levels) to analyze the metaproteomic dataset. First, a quantitative comparison in terms of number and overlap of peptide identifications was carried out among all databases. As a result, only 35% of peptides were common to all database classes; moreover, genus/species-specific databases provided up to 17% more identifications compared to databases with generic taxonomy, while the metagenomic database enabled a slight increment in respect to public databases. Then, database behavior in terms of false discovery rate and peptide degeneracy was critically evaluated. Public databases with generic taxonomy exhibited a markedly different trend compared to the counterparts. Finally, the reliability of taxonomic attribution according to the lowest common ancestor approach (using MEGAN and Unipept software) was assessed. The level of misassignments varied among the different databases, and specific thresholds based on the number of taxon-specific peptides were established to minimize false positives. This study confirms that database selection has a significant impact in metaproteomics, and provides critical indications for improving depth and reliability of metaproteomic results. Specifically, the use of iterative searches and of suitable filters for taxonomic assignments is proposed with the aim of increasing coverage and trustworthiness of metaproteomic data.
Conflict of interest statement
Figures
References
-
- Hood L (2012) Tackling the microbiome. Science 336: 1209. - PubMed
-
- Roling WF, Ferrer M, Golyshin PN (2010) Systems approaches to microbial communities and their functioning. Curr Opin Biotechnol 21: 532–538. - PubMed
-
- Mikeskova H, Novotny C, Svobodova K (2012) Interspecific interactions in mixed microbial cultures in a biodegradation perspective. Appl Microbiol Biotechnol 95: 861–870. - PubMed
-
- Larsen P, Hamada Y, Gilbert J (2012) Modeling microbial communities: current, developing, and future technologies for predicting microbial community interaction. J Biotechnol 160: 17–24. - PubMed
Publication types
MeSH terms
Substances
LinkOut - more resources
Full Text Sources
Other Literature Sources
Molecular Biology Databases
Research Materials
Miscellaneous
