

Validation and calibration of a computer simulation model of pediatric HIV infection
- PMID: 24349503
- PMCID: PMC3862684
- DOI: 10.1371/journal.pone.0083389
Validation and calibration of a computer simulation model of pediatric HIV infection
Abstract
Background: Computer simulation models can project long-term patient outcomes and inform health policy. We internally validated and then calibrated a model of HIV disease in children before initiation of antiretroviral therapy to provide a framework against which to compare the impact of pediatric HIV treatment strategies.
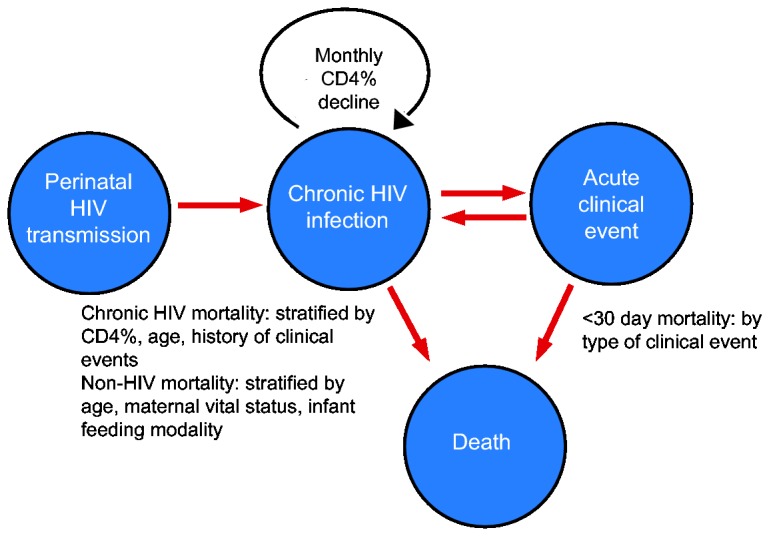
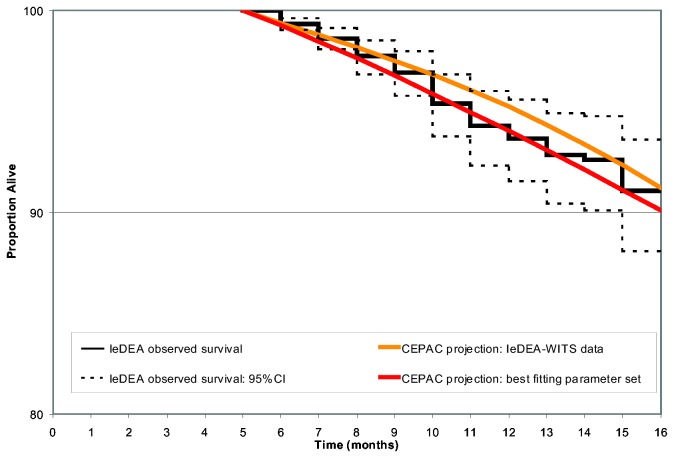
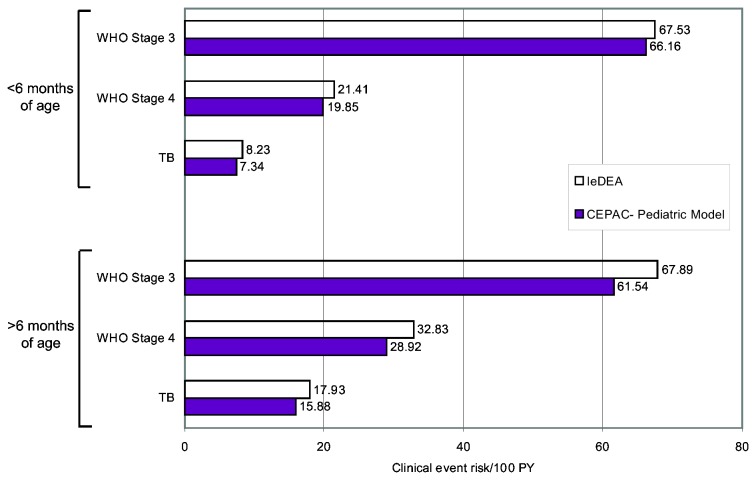
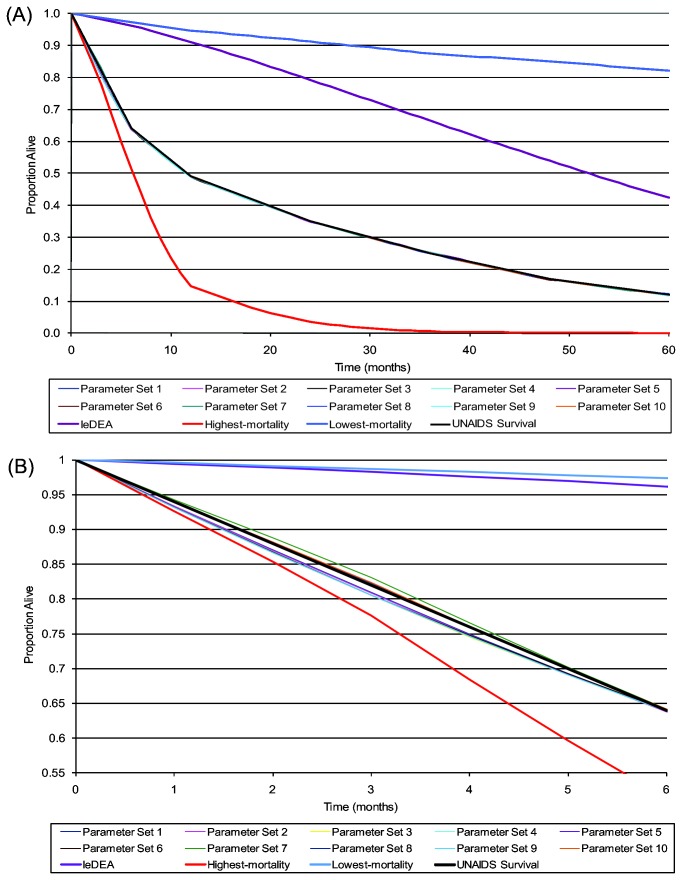
Methods: We developed a patient-level (Monte Carlo) model of HIV progression among untreated children <5 years of age, using the Cost-Effectiveness of Preventing AIDS Complications model framework: the CEPAC-Pediatric model. We populated the model with data on opportunistic infection and mortality risks from the International Epidemiologic Database to Evaluate AIDS (IeDEA), with mean CD4% at birth (42%) and mean CD4% decline (1.4%/month) from the Women and Infants' Transmission Study (WITS). We internally validated the model by varying WITS-derived CD4% data, comparing the corresponding model-generated survival curves to empirical survival curves from IeDEA, and identifying best-fitting parameter sets as those with a root-mean square error (RMSE) <0.01. We then calibrated the model to other African settings by systematically varying immunologic and HIV mortality-related input parameters. Model-generated survival curves for children aged 0-60 months were compared, again using RMSE, to UNAIDS data from >1,300 untreated, HIV-infected African children.
Results: In internal validation analyses, model-generated survival curves fit IeDEA data well; modeled and observed survival at 16 months of age were 91.2% and 91.1%, respectively. RMSE varied widely with variations in CD4% parameters; the best fitting parameter set (RMSE = 0.00423) resulted when CD4% was 45% at birth and declined by 6%/month (ages 0-3 months) and 0.3%/month (ages >3 months). In calibration analyses, increases in IeDEA-derived mortality risks were necessary to fit UNAIDS survival data.
Conclusions: The CEPAC-Pediatric model performed well in internal validation analyses. Increases in modeled mortality risks required to match UNAIDS data highlight the importance of pre-enrollment mortality in many pediatric cohort studies.
Conflict of interest statement
Figures
Similar articles
-
The effect of early initiation of antiretroviral treatment in infants on pediatric AIDS mortality in South Africa: a model-based analysis.Pediatr Infect Dis J. 2012 May;31(5):474-80. doi: 10.1097/INF.0b013e3182456ba2. Pediatr Infect Dis J. 2012. PMID: 22189531
-
Incidence of World Health Organization stage 3 and 4 events, tuberculosis and mortality in untreated, HIV-infected children enrolling in care before 1 year of age: an IeDEA (International Epidemiologic Databases To Evaluate AIDS) East Africa regional analysis.Pediatr Infect Dis J. 2014 Jun;33(6):623-9. doi: 10.1097/INF.0000000000000223. Pediatr Infect Dis J. 2014. PMID: 24378935 Free PMC article.
-
Access to antiretroviral therapy in HIV-infected children aged 0-19 years in the International Epidemiology Databases to Evaluate AIDS (IeDEA) Global Cohort Consortium, 2004-2015: A prospective cohort study.PLoS Med. 2018 May 4;15(5):e1002565. doi: 10.1371/journal.pmed.1002565. eCollection 2018 May. PLoS Med. 2018. PMID: 29727458 Free PMC article.
-
Immunologic targets of HIV infection: T cells. NICHD IVIG Clinical Trial Group, and the NHLBI P2C2 Pediatric Pulmonary and Cardiac Complications of HIV Infection Study Group.Ann N Y Acad Sci. 1993 Oct 29;693:35-51. doi: 10.1111/j.1749-6632.1993.tb26255.x. Ann N Y Acad Sci. 1993. PMID: 7903519 Review.
-
Pediatric AIDS and perinatal HIV infection in Zaire: epidemiologic and pathologic findings.Prog AIDS Pathol. 1992;3(1):1-33. Prog AIDS Pathol. 1992. PMID: 1606299 Review.
Cited by
-
Incorporating the HIV Infant Tracking System into standard-of-care early infant diagnosis of HIV services in Kenya: a cost-effectiveness analysis of the HITSystem randomised trial.Lancet Glob Health. 2023 Aug;11(8):e1217-e1224. doi: 10.1016/S2214-109X(23)00216-4. Lancet Glob Health. 2023. PMID: 37474229 Free PMC article. Clinical Trial.
-
Optimal breastfeeding durations for HIV-exposed infants: the impact of maternal ART use, infant mortality and replacement feeding risk.J Int AIDS Soc. 2018 Apr;21(4):e25107. doi: 10.1002/jia2.25107. J Int AIDS Soc. 2018. PMID: 29667336 Free PMC article.
-
Cost-effectiveness of point-of-care versus centralised, laboratory-based nucleic acid testing for diagnosis of HIV in infants: a systematic review of modelling studies.Lancet HIV. 2023 May;10(5):e320-e331. doi: 10.1016/S2352-3018(23)00029-2. Lancet HIV. 2023. PMID: 37149292 Free PMC article.
-
Prevalence of undiagnosed HIV among children in South Africa, Côte d'Ivoire and Zimbabwe: a model-based analysis to inform paediatric HIV screening programmes.J Int AIDS Soc. 2022 Dec;25(12):e26045. doi: 10.1002/jia2.26045. J Int AIDS Soc. 2022. PMID: 36519674 Free PMC article.
-
Cost-effectiveness of Routine Provider-Initiated Testing and Counseling for Children With Undiagnosed HIV in South Africa.Open Forum Infect Dis. 2021 Dec 5;9(1):ofab603. doi: 10.1093/ofid/ofab603. eCollection 2022 Jan. Open Forum Infect Dis. 2021. PMID: 35028333 Free PMC article.
References
-
- Prendergast A, Cotton M, Gibb DM (2008) When should antiretroviral therapy be started for HIV-infected infants in resource-limited settings? Futures - Journal of HIV Therapy 2: 201-208.
-
- World Health Organization (2010) Antiretroviral therapy for HIV infection in infants and children: Recommendations for a public health approach. - PubMed
-
- Freedberg KA, Losina E, Weinstein MC, Paltiel AD, Cohen CJ et al. (2001) The cost effectiveness of combination antiretroviral therapy for HIV disease. N Engl J Med 344: 824-831. - PubMed
-
- Goldie SJ, Yazdanpanah Y, Losina E, Weinstein MC, Anglaret X, et al. (2006) Cost-effectiveness of HIV treatment in resource-poor settings--the case of Côte d'Ivoire. N Engl J Med 355: 1141-1153. - PubMed
Publication types
MeSH terms
Grants and funding
- U01 AI068632/AI/NIAID NIH HHS/United States
- UM1 AI068632/AI/NIAID NIH HHS/United States
- HHSN267200800001C/HD/NICHD NIH HHS/United States
- U01 AI041110/AI/NIAID NIH HHS/United States
- N01-DK-9-001/HHSN267200800001C/DK/NIDDK NIH HHS/United States
- R01 AI058736/AI/NIAID NIH HHS/United States
- F32 AI009919/AI/NIAID NIH HHS/United States
- HHSN267200800001G/DK/NIDDK NIH HHS/United States
- K24 AI062476/AI/NIAID NIH HHS/United States
- U01 AI068616/AI/NIAID NIH HHS/United States
- U01AI09919/AI/NIAID NIH HHS/United States
- U01 AI069911/AI/NIAID NIH HHS/United States
- K01 AI078754/AI/NIAID NIH HHS/United States
- R01 AI093269/AI/NIAID NIH HHS/United States
- AI068632/AI/NIAID NIH HHS/United States
- 1 U01 AI068616/AI/NIAID NIH HHS/United States
- 5 U01 AI41110/AI/NIAID NIH HHS/United States
LinkOut - more resources
Full Text Sources
Other Literature Sources
Medical
Research Materials
