

Transcriptomic changes induced by mycophenolic acid in gastric cancer cells
- PMID: 24349619
- PMCID: PMC3853422
Transcriptomic changes induced by mycophenolic acid in gastric cancer cells
Abstract
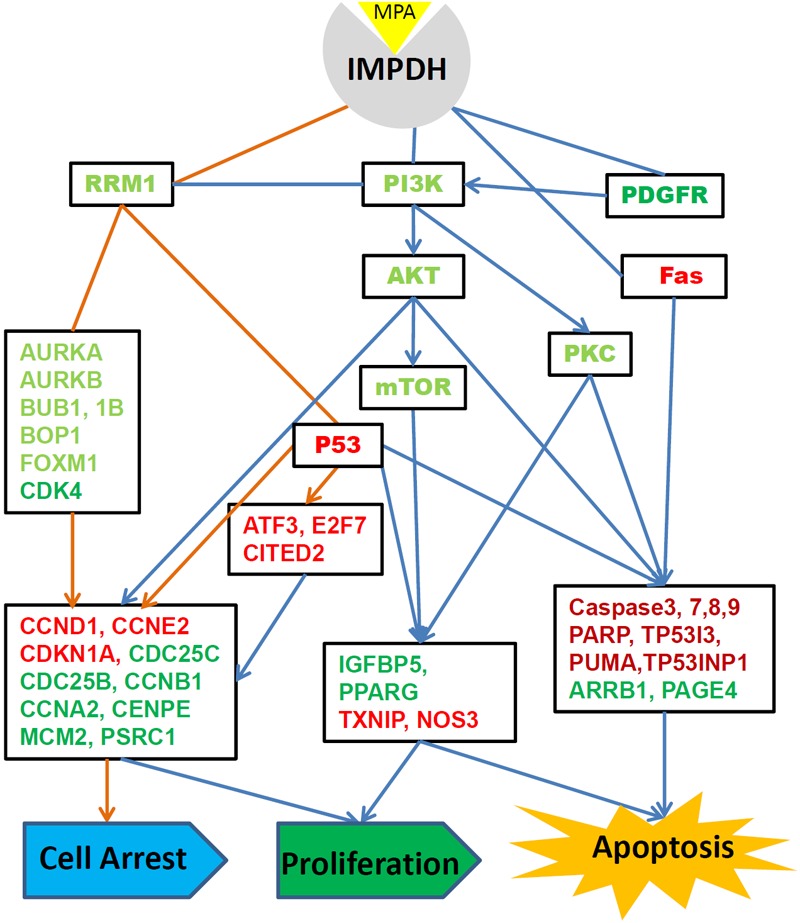
Background: Inhibition of inosine monophosphate dehydrogenase (IMPDH) by mycophenolic acid (MPA) can inhibit proliferation and induce apoptosis in cancer cells. This study investigated the underlying molecular mechanisms of MPA's anticancer activity.
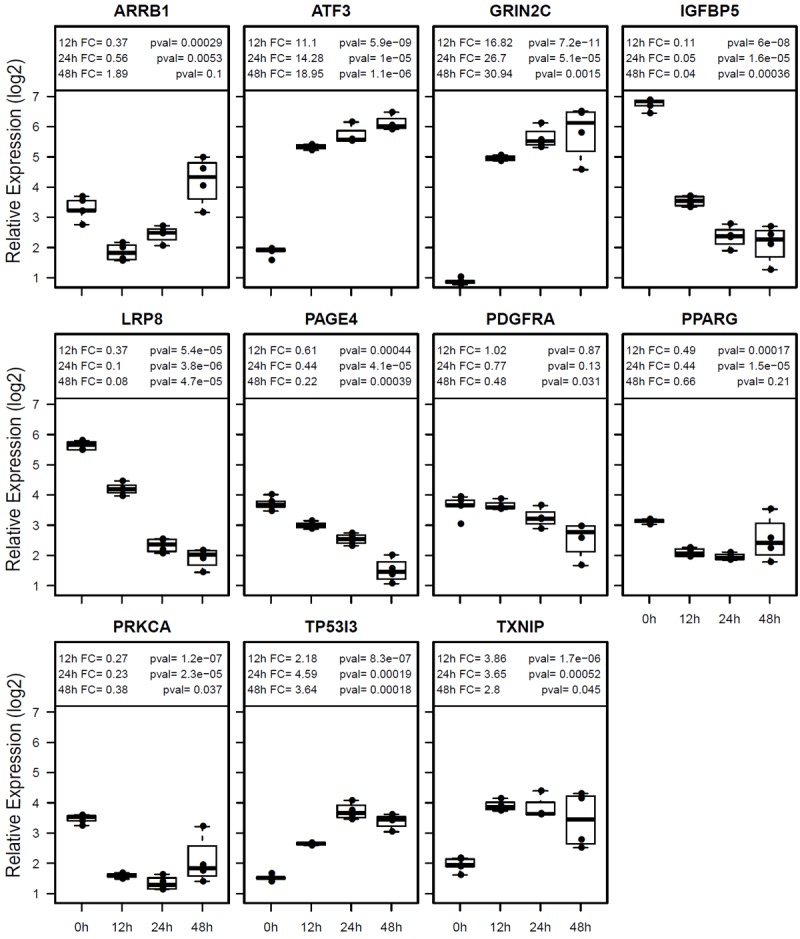
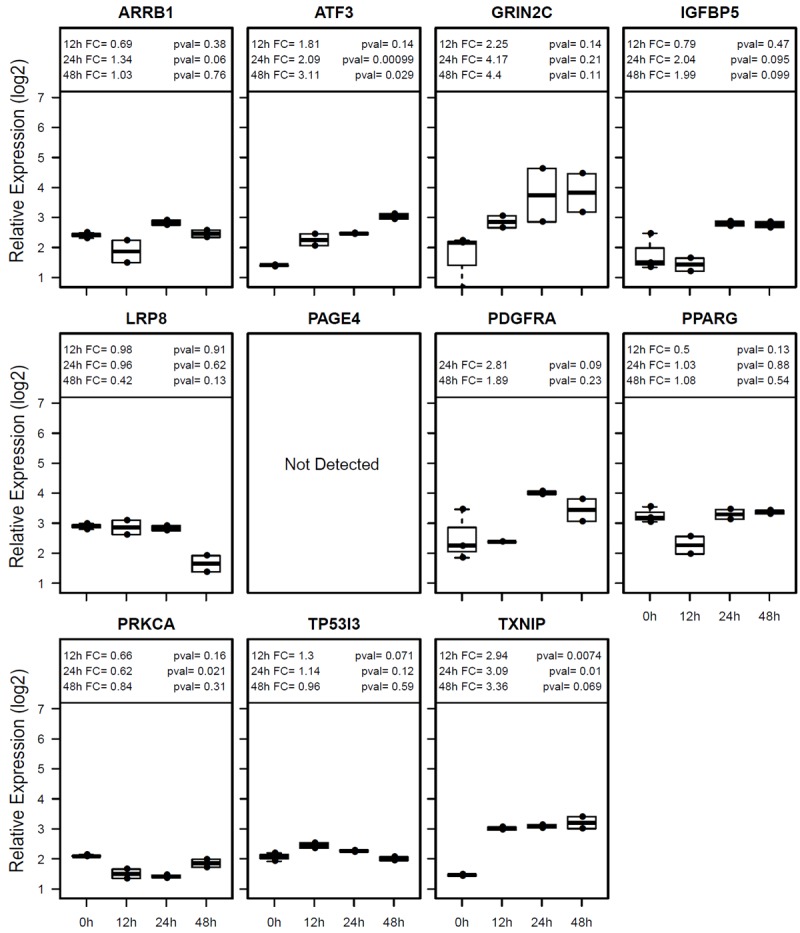
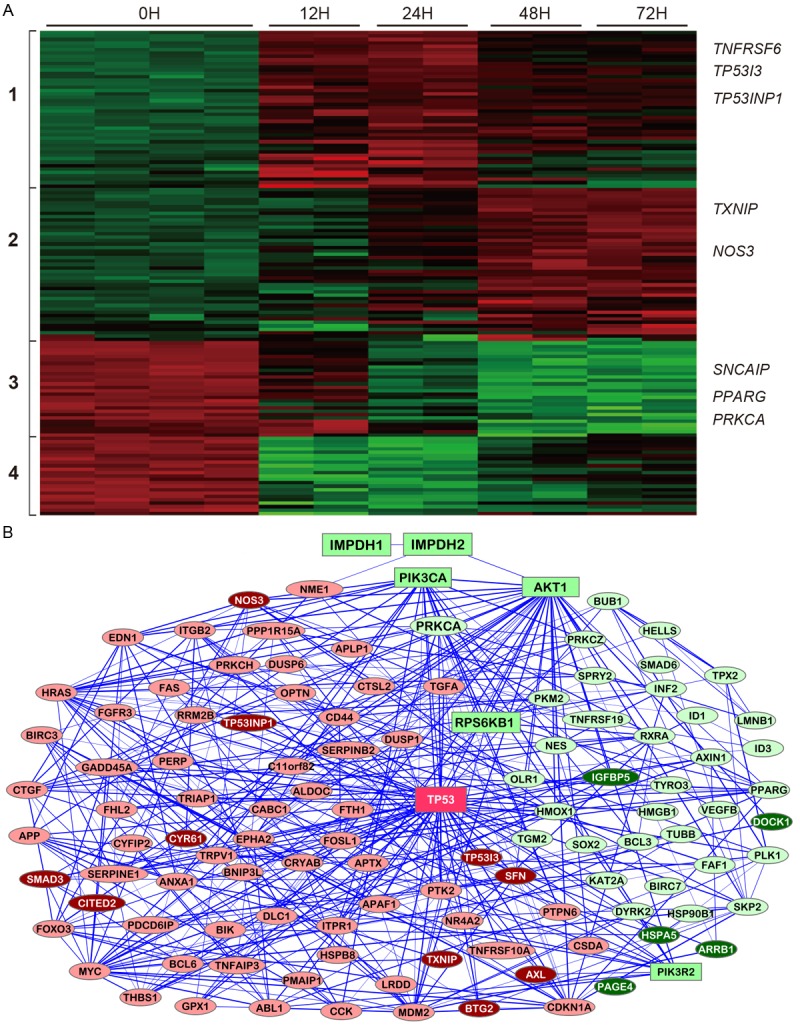
Methods: A gastric cancer cell line (AGS) was treated with MPA and gene expression at different time points was analyzed using Illumina whole genome microarrays and selected genes were confirmed by real-time RT-PCR.
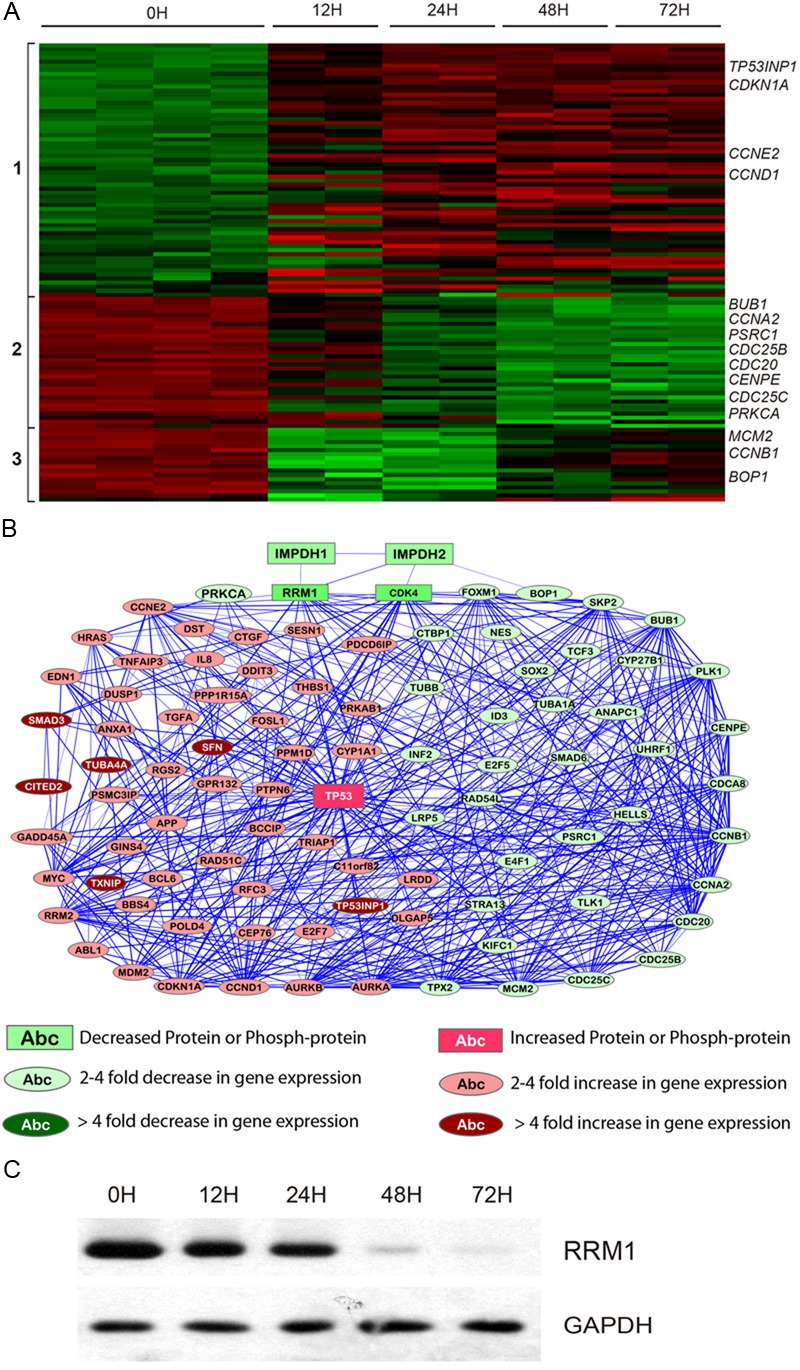
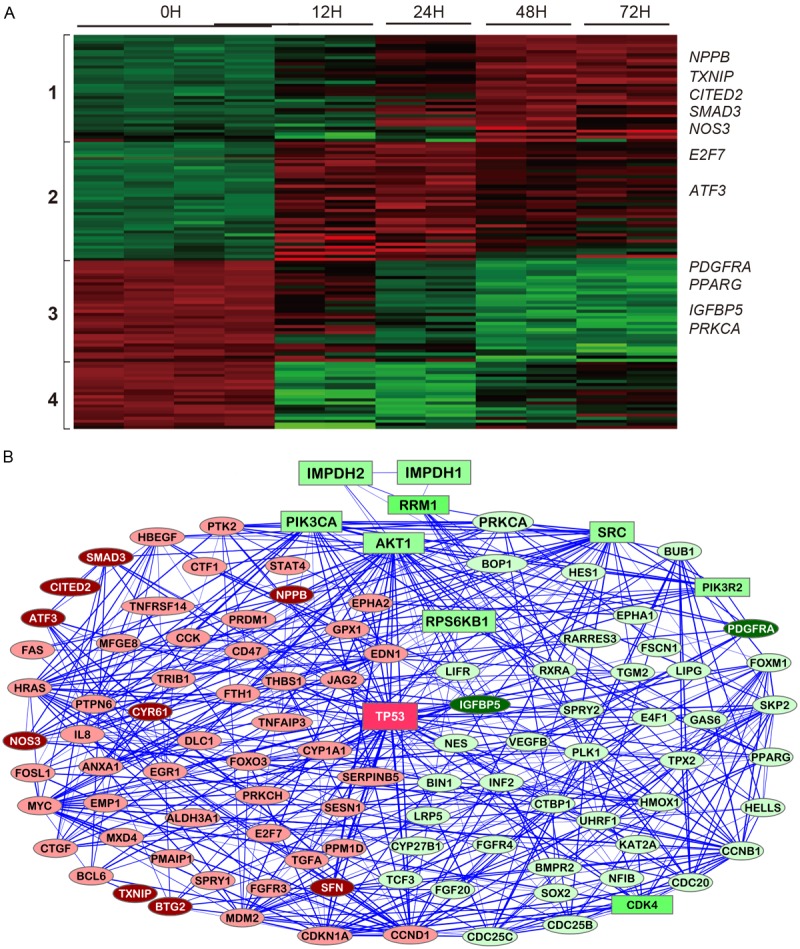
Results: Transcriptomic profiling identified 1070 genes with ≥2 fold changes and 85 genes with >4 fold alterations. The most significantly altered biological processes by MPA treatment include cell cycle, apoptosis, cell proliferation and migration. MPA treatment altered at least ten KEGG pathways, of which eight (p53 signaling, cell cycle, pathways in cancer, PPAR signaling, bladder cancer, protein processing in ER, small cell lung cancer and MAPK signaling) are cancer-related. Among the earliest cellular events induced by MPA is cell cycle arrest which may be caused by six molecular pathways: 1) up-regulation of cyclins (CCND1 and CCNE2) and down-regulation of CCNA2 and CCNB1, 2) down-regulation of cyclin-dependent kinases (CDK4 and CDK5); 3) inhibition of cell division related genes (CDC20, CDC25B and CDC25C) and other cell cycle related genes (MCM2, CENPE and PSRC1), 4) activation of p53, which activates the cyclin-dependent kinase inhibitors (CDKN1A), 5) impaired spindle checkpoint function and chromosome segregation (BUB1, BUB1B, BOP1, AURKA, AURKB, and FOXM1); and 6) reduction of availability of deoxyribonucleotides and therefore DNA synthesis through down-regulation of the RRM1 enzyme. Cell cycle arrest is followed by inhibition of cell proliferation, which is mainly attributable to the inhibition of the PI3K/AKT/mTOR pathway, and caspase-dependent apoptosis due to up-regulation of the p53 and FAS pathways.
Conclusions: These results suggest that MPA has beneficial anticancer activity through diverse molecular pathways and biological processes.
Keywords: MPA; drug repurposing; microarray; regulatory networks.
Figures
References
-
- Morath C, Schwenger V, Beimler J, Mehrabi A, Schmidt J, Zeier M, Muranyi W. Antifibrotic actions of mycophenolic acid. Clin Transplant. 2006;20(Suppl 17):25–29. - PubMed
-
- Allison AC, Eugui EM. Mycophenolate mofetil and its mechanisms of action. Immunopharmacology. 2000;47:85–118. - PubMed
-
- Jackson RC, Weber G, Morris HP. IMP dehydrogenase, an enzyme linked with proliferation and malignancy. Nature. 1975;256:331–333. - PubMed
-
- Fellenberg J, Bernd L, Delling G, Witte D, Zahlten-Hinguranage A. Prognostic significance of drug-regulated genes in high-grade osteosarcoma. Mod Pathol. 2007;20:1085–1094. - PubMed
LinkOut - more resources
Full Text Sources
Other Literature Sources
Molecular Biology Databases
Research Materials
Miscellaneous