

Mass resolution and mass accuracy: how much is enough?
- PMID: 24349928
- PMCID: PMC3809961
- DOI: 10.5702/massspectrometry.S0009
Mass resolution and mass accuracy: how much is enough?
Abstract
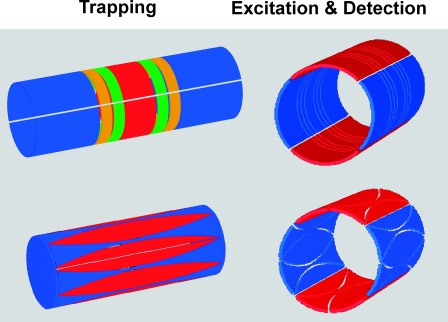
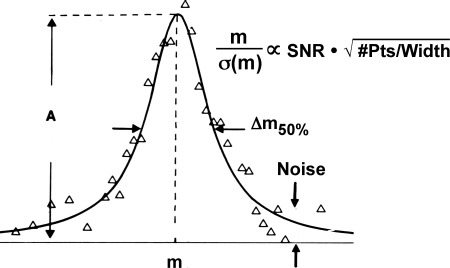
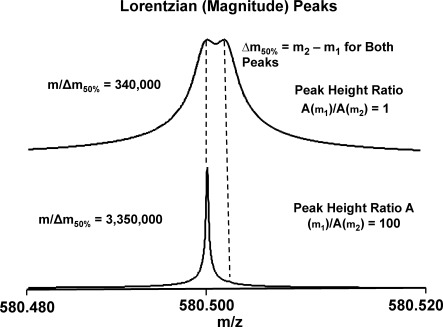
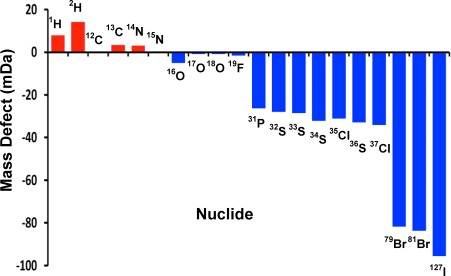
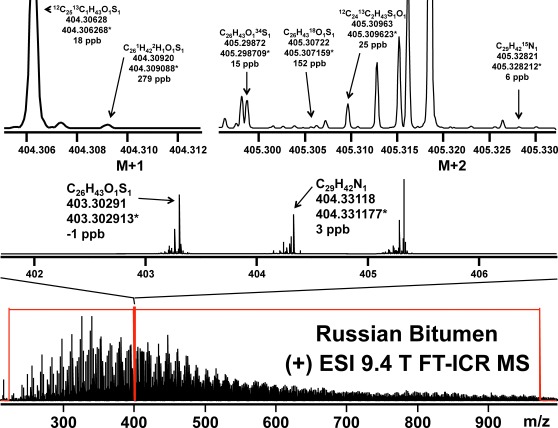
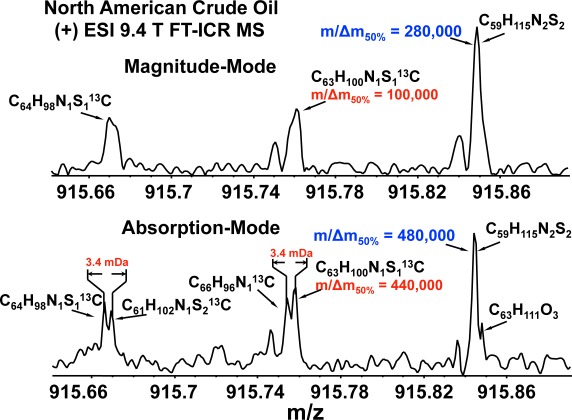
Accurate mass measurement requires the highest possible mass resolution, to ensure that only a single elemental composition contributes to the mass spectral peak in question. Although mass resolution is conventionally defined as the closest distinguishable separation between two peaks of equal height and width, the required mass resolving power can be ∼10× higher for equal width peaks whose peak height ratio is 100 : 1. Ergo, minimum resolving power requires specification of maximum dynamic range, and is thus 10-100× higher than the conventional definition. Mass resolving power also depends on mass-to-charge ratio. Mass accuracy depends on mass spectral signal-to-noise ratio and digital resolution. Finally, the reliability of elemental composition assignment can be improved by resolution of isotopic fine structure. Thus, the answer to the question of "how much is enough mass resolving power" requires that one first specify S/N ratio, dynamic range, digital resolution, mass-to-charge ratio, and (if available) isotopic fine structure. The highest available broadband mass resolving power and mass accuracy is from Fourier transform ion cyclotron resonance mass spectrometry. Over the past five years, FT-ICR MS mass accuracy has improved by about an order of magnitude, based on higher magnetic field strength, conditional averaging of time-domain transients, better mass calibration (spectral segmentation; inclusion of a space charge term); radially dispersed excitation; phase correction to yield absorption-mode display; and new ICR cell segmentation designs.
Keywords: FTMS; Fourier transform; ion cyclotron resonance; isotopic fine structure.
Figures
References
-
- 1) A. G. Marshall, C. L. Hendrickson, G. S. Jackson. Fourier transform ion cyclotron resonance mass spectrometry: A primer. Mass Spectrom. Rev. 17: 1–35, 1998 - PubMed
-
- 4) E. N. Nikolaev, R. M. A. Heeren, A. M. Popov, A. V. Pozdneev, K. S. Chingin. Realistic modeling of ion cloud motion in a Fourier transform ion cyclotron resonance cell by use of a particle-in-cell approach. Rapid Commun. Mass Spectrom. 21: 3527–3546, 2007 - PubMed
-
- 5) F. E. Leach 3rd, A. Kharchenko, R. M. A. Heeren, E. N. Nikolaev, I. J. Amster. Comparison of particle-in-cell simulations with experimentally observed frequency shifts between ions of the same mass-to-charge in Fourier transform ion cyclotron resonance mass spectrometry. J. Am. Soc. Mass Spectrom. 21: 203–208, 2010 - PMC - PubMed
LinkOut - more resources
Full Text Sources
Other Literature Sources
Miscellaneous