

Review
doi: 10.1021/cr400475g.
Epub 2013 Dec 18.
Intrigues and intricacies of the biosynthetic pathways for the enzymatic quinocofactors: PQQ, TTQ, CTQ, TPQ, and LTQ
Affiliations
- PMID: 24350630
- PMCID: PMC3999297
- DOI: 10.1021/cr400475g
Item in Clipboard
Review
Intrigues and intricacies of the biosynthetic pathways for the enzymatic quinocofactors: PQQ, TTQ, CTQ, TPQ, and LTQ
Chem Rev.
.
No abstract available
Figures
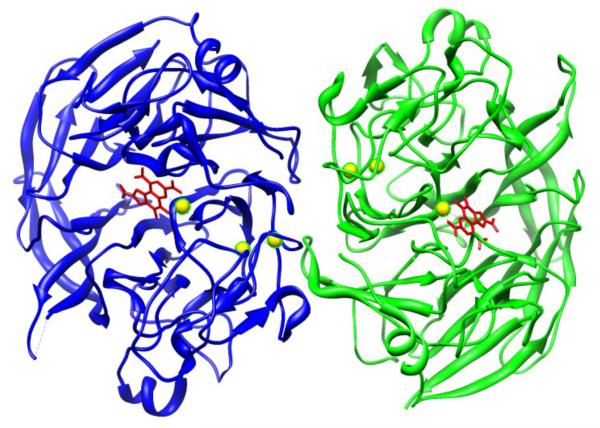
Ribbon diagram of the overall structure of the dimer of glucose dehydrogenase from Acetinobacter calcoaceticus with PQQ (red). The spheres in yellow are Ca2+. Modified from ref. (11).
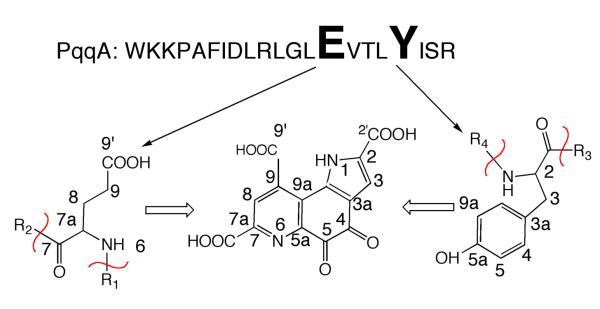
PQQ is derived from the conserved Glu and Tyr within PqqA. The sequence shown for PqqA is from K. pneumoniae. From ref. (33).
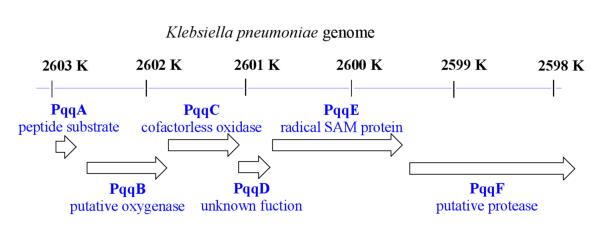
The PQQ biosynthetic operon in K. pneumoniae. From ref. (33).
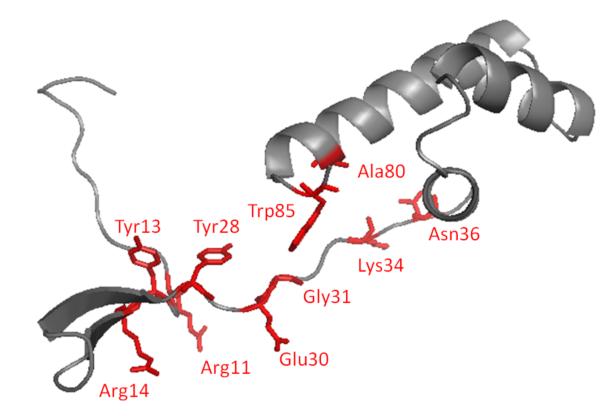
Structure of PqqD in K. pneumoniae from X. campestris. While this structure is illustrated as a single subunit, it is a dimer in the crystal. From ref. (23).
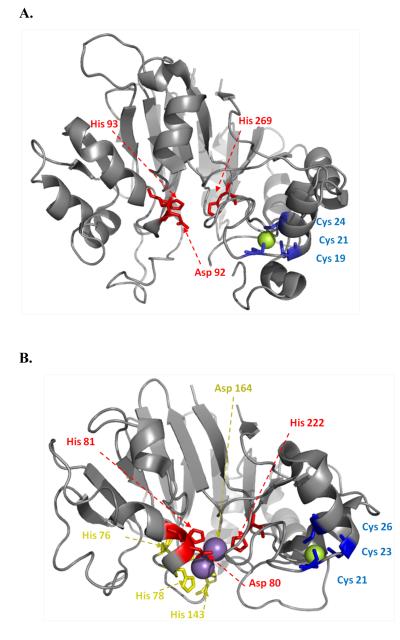
Structure of PqqB from Pseudomonas putida (A) in relation to its closest homolog; PhnP from E. coli (B). The active site of PqqB shows a 2-His/1-carboxylate facial triad configuration, characteristic of the non-heme metal-binding oxygenase family. As shown, PqqB contains Zn2+ (green) at the structural site but no metal at the active site. The Mn in PhnP is colored purple. From ref. (23).
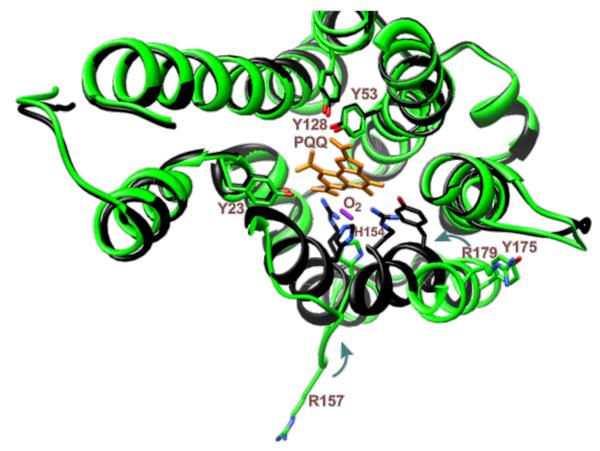
Structure of PqqC from K. pneumoniae. [(From ref. (53)] The structure in green is the open configuration and the black structure is the closed configuration containing bound PQQ. The red diatomic is labeled as O2, but could be H2O2. The R157 in the closed structure is to the left of R179.
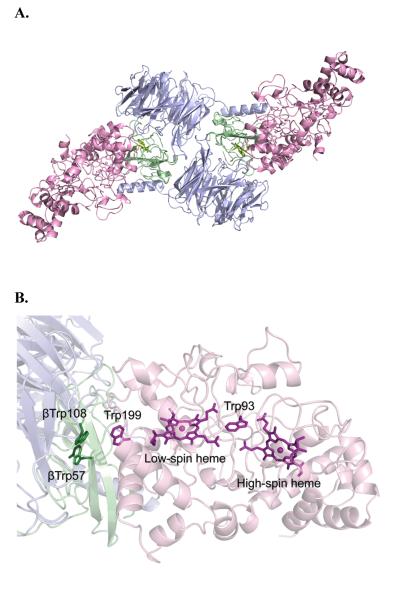
Three-dimensional structure of the preMADH-MauG complex. Color scheme is MauG (pink); preMADH α (blue), and β (green). A. Three-dimensional structure of the preMADH-MauG complex (PDB code 3L4M). B. Spatial layout of potential redox groups. A portion of the crystal structure. Residues Trp57 and Trp108 at the β subunit of MADH, Trp199 of the α subunit of MADH and the two hemes of MauG are displayed as sticks. From ref. (73).
Structure of the mature form of MADH (PDB code: 2bbk). The MADH α subunit is blue and the β subunit is green. From ref. (85).
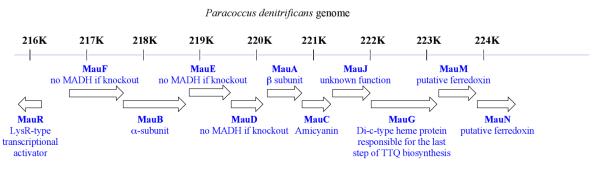
The operon structure of mau gene cluster of P. denitrificans. From ref. (85).
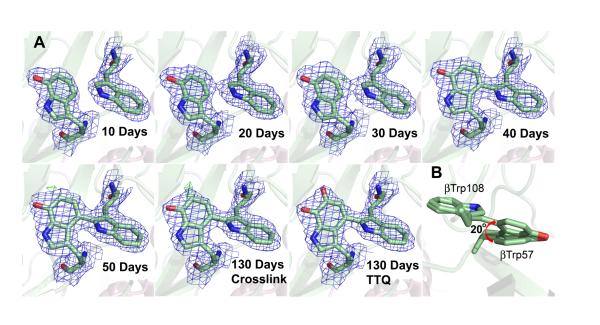
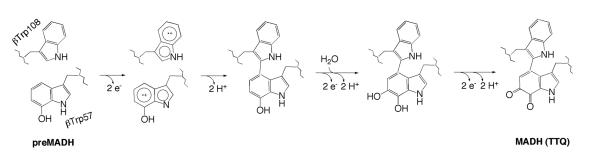
A. X-ray detected intermediates during TTQ biosynthesis. B. The observed rotation in β Trp57–OH during cross-link formation. From ref. (78).
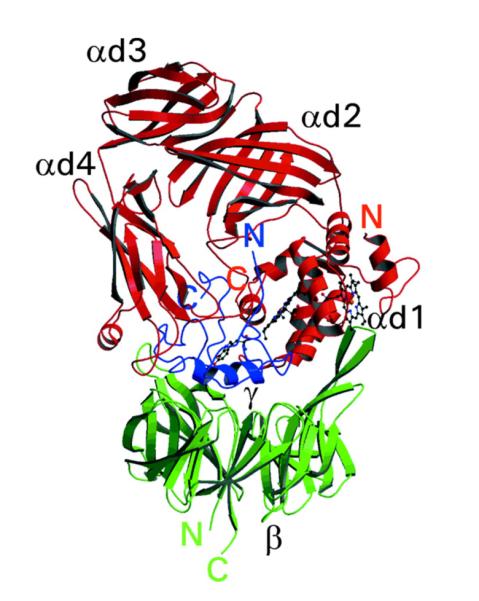
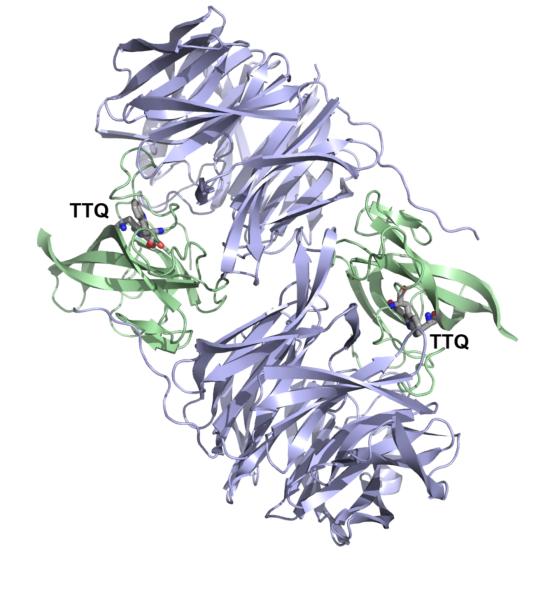
Three-dimensional structure of QHNDH from P. denitrificans. From ref. (16).
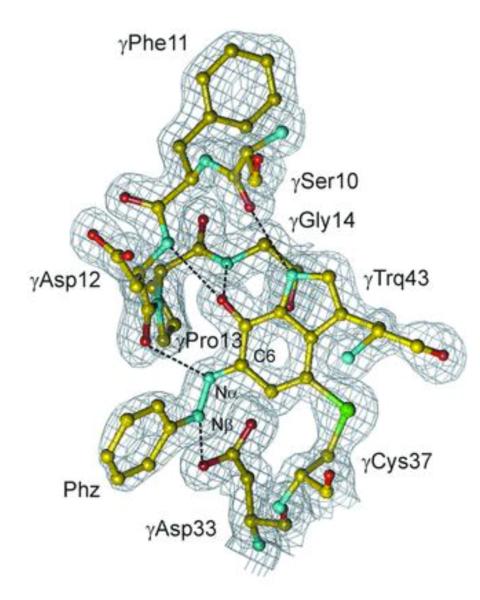
Structure of the phenylhydrazine complex (Phz) of QHNDH and its relationship to the active site base, Asp33. Trq is tryptophylquinone. The gray netting represents electron density. From ref. (88).
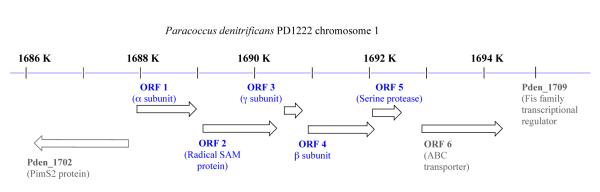
The operon structure of QHNDH and associated genes. From ref (89).
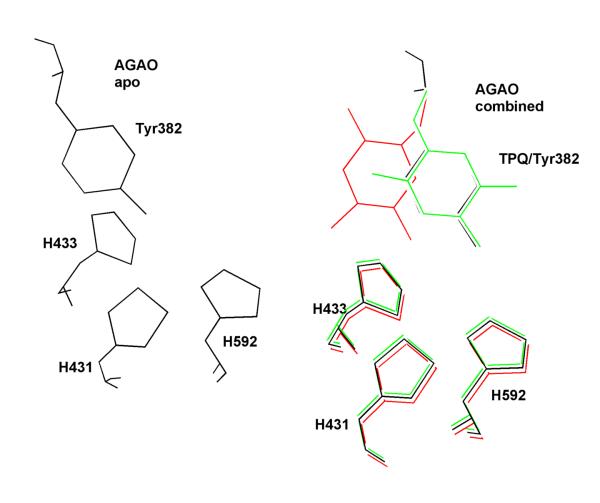
Active site in (left) apo-A. globiformis CAO and in (right) a superposition of the active form of holo-AGAO (red) with the inactive form of holo-AGAO (green) and the apo-AGAO (black). His431, 433, and 592 act as ligands to the active site copper in the holo-forms. Adapted from ref. (99).
Proposed loop structure provided by Asn404 and Glu406 within the active site of HPAO. Residues from the A subunit are gray and those from the B subunit yellow. Oxygen atoms are red, and nitrogen atoms are blue. Connectivity is shown by solid lines between residues, and hydrogen bonding distances are given for these interactions (from PDB file 1A2V). All CAOs are homodimers. From ref. (102).
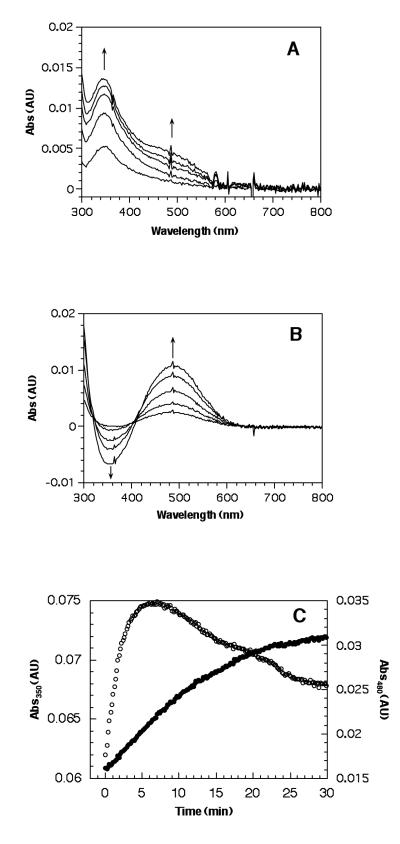
Precursor-product relationship for the active 350 nm species in TPQ formation within HPAO. These graphs represent spectroscopic changes following the oxygenation of enzyme where Cu2+ has been pre-bound anaerobically. A. Absorbance changes following exposure to O2. Spectra are at 1, 2, 3, 4, and 5 min following exposure to oxygen; the spectrum before oxygenation has been subtracted. Arrows indicate the direction of change. B. Absorbance changes during the decay of the 350 nm species. Spectra are 8, 10, 14, 20, and 30 min following the introduction of O2; the spectrum at 5 min after aeration has been subtracted. Arrows indicate the direction of change. C. Kinetics of the reaction with O2 at 350 nm (○) and 480 nm (●). From ref. (112).
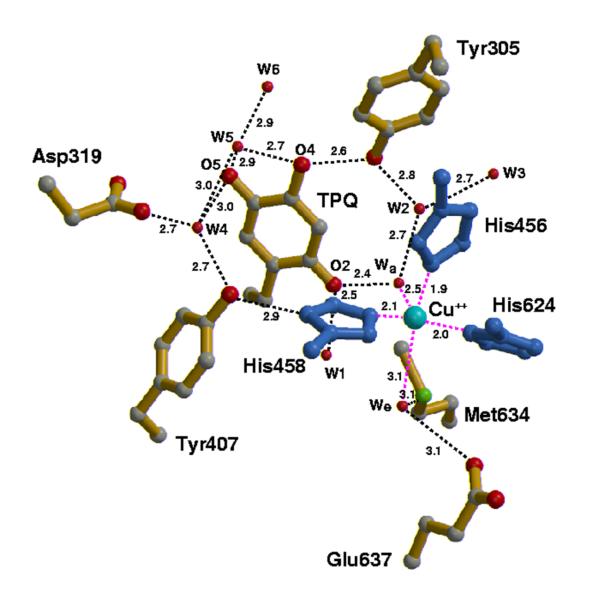
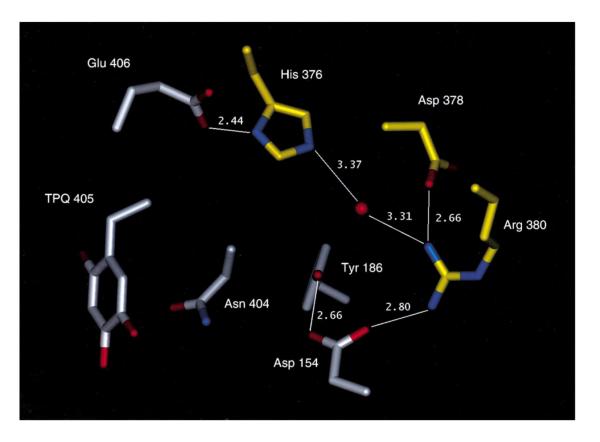
Active conformation of TPQ within the active site of copper amine oxidase from H. polymorpha. Hydrogen bonds are indicated by dashed lines and distances are in angstroms. A water molecule is represented by a red sphere. The Met634 that is implicated in O2 binding is seen adjacent to the active site Cu2+. From ref. (94).
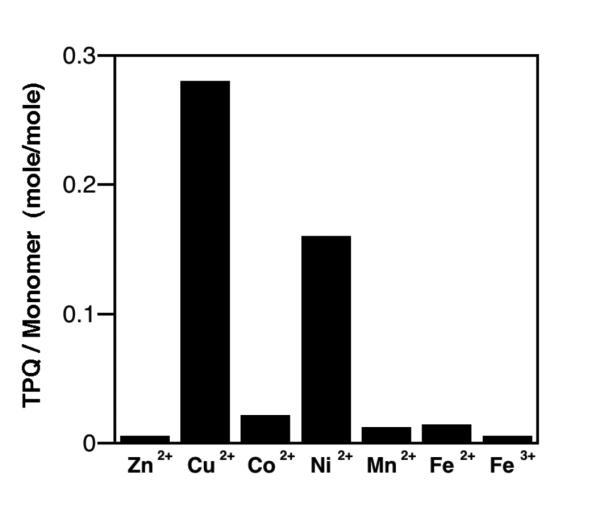
Bar graph for impact of metal replacement in HPAO biogenesis. From ref. (124).
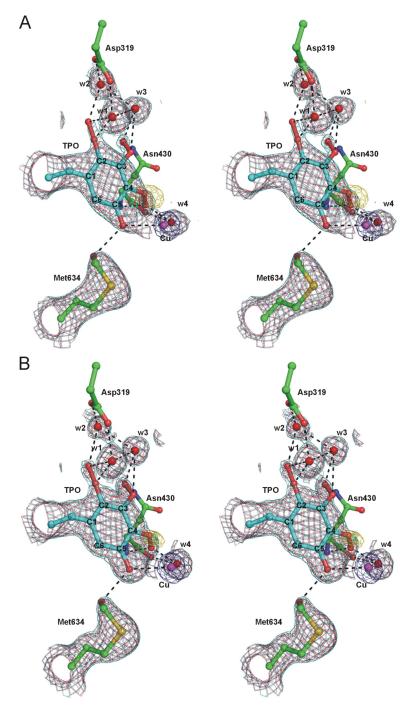
Final electron density maps of the Y305F mutants of HPAO computed using coefficients (2Fo – Fc) and (Fo – Fc) where Fc was calculated from the models refined with TPO and the modified Met634 present. The (2Fo – Fc) maps are contoured at the 0.8 (cyan), 1.0 (crimson), and 8.0 (dark blue) σ levels, and the (F° – Fc) maps are contoured at the –3.0σ level (gold); no contours above the +3.0σ level are present. Hydrogen and coordination bonds are indicated by black dashed lines. A. The E. coli-expressed structure is shown. B. The yeast-expressed structure is shown. TPO is the abbreviation for the hyper-oxidized derivative of Y405. From ref. (131).
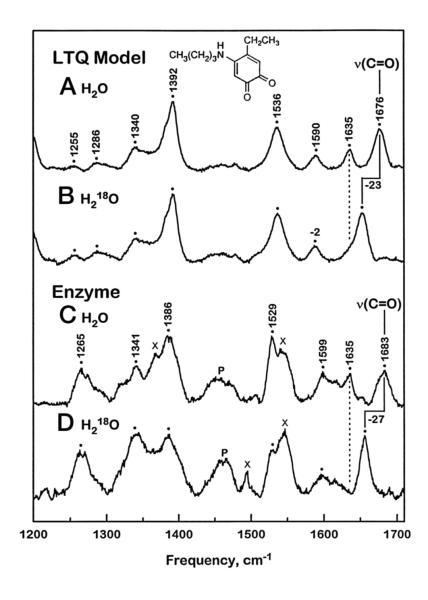
RR spectra of native lysyl oxidase in relation to a representative model compound. From ref. (136).
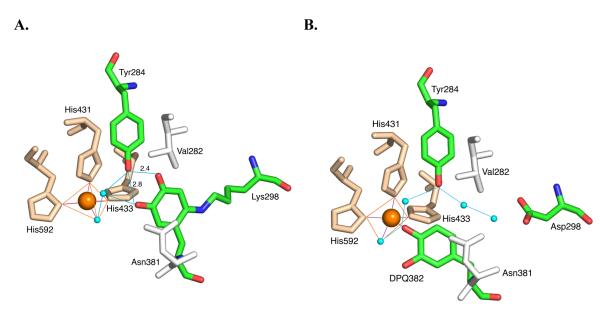
X-ray structures for AGAO. A. The product formed in the D298Kmutant of AGAO. B. The putative dopaquinone intermediate. From ref. (159). The blue spheres are water molecules, the red lines show ligands to the Cu2+ and the blue lines show hydrogen-bonded networks. From ref. (139).
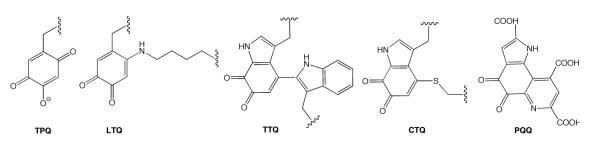
Structures of the established quinocofactors, TPQ, LTQ, TTQ, CTQ, and PQQ.
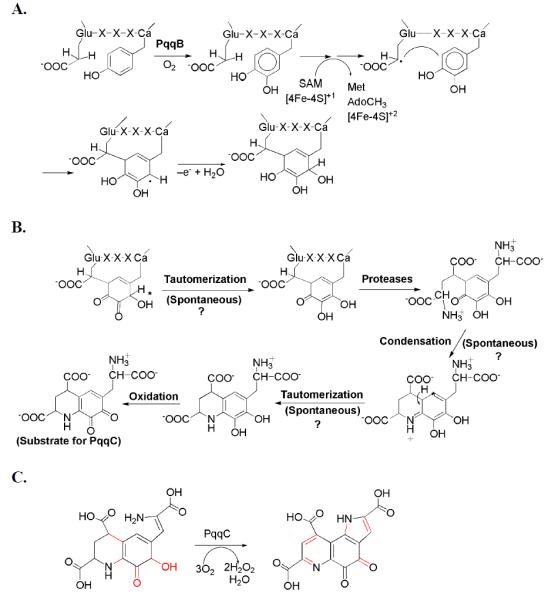
A speculative pathway for the production of PQQ, illustrating the large number of unknown features. A. A working mechanism invokes hydroxylation of the conserved Tyr within PqqA by PqqB, prior to the action of PqqE. B. The limited number of conserved components of the PQQ operon suggests the presence of a number of spontaneous (non-catalyzed) steps. C. The last step, in which AHQQ is converted to PQQ, is established.
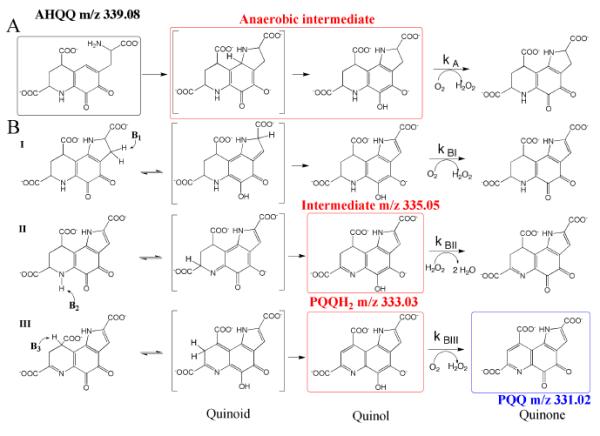
The four partial reactions catalyzed by PqqC. The reaction intermediates that have been detected are shown in the red boxes and the oxidized product is in blue. The final species formed in vivo is likely to be PQQH2, which is proposed to dissociate from PqqC before its final oxidation to PQQ. Adapted from ref. (53).
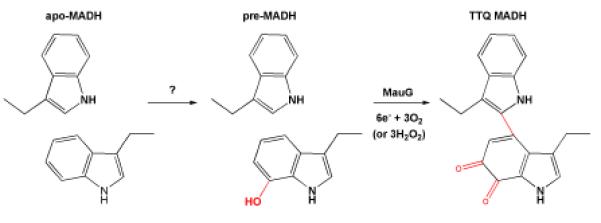
Schematic for the production of TTQ.
Proposed mechanism of MauG. From ref. (78).
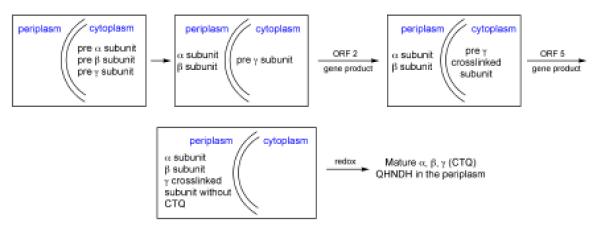
Summary of likely sequence for the processing steps in CTQ production.
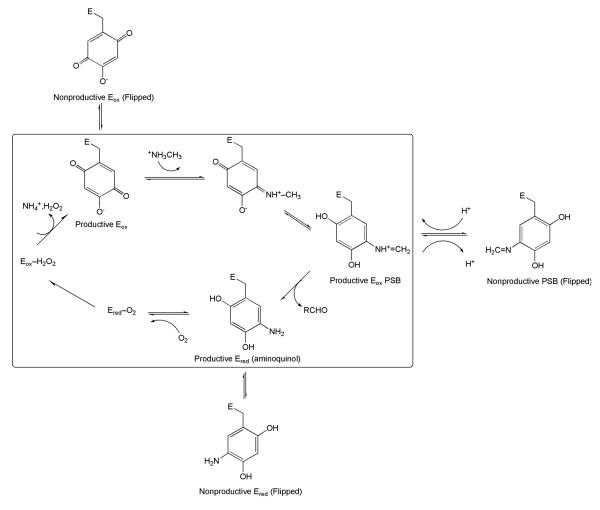
Impact of mutation of the consensus sequence within the TPQ-containing H. polymorpha amine oxidase on catalytic intermediates. The catalytically productive intermediates are shown in the box. Adapted from ref. (102).
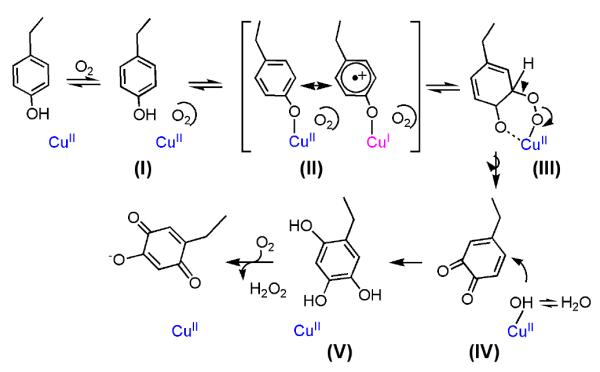
Mechanism of TPQ production. [Adapted fron ref. (17)].
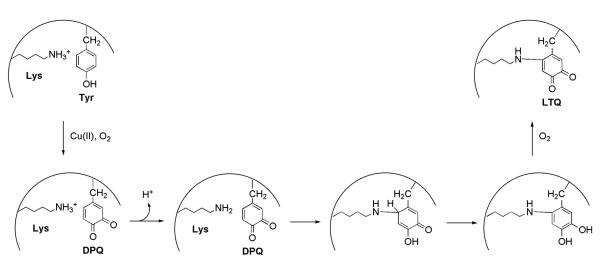
Postulated pathway for the production of LTQ. [Adapted from ref. (139)]. DPQ is dopaquinone.
References
Publication types
MeSH terms
Substances
Grants and funding
LinkOut - more resources
Full Text Sources
Other Literature Sources
