. 2014 Jan 28;8(1):302-15.
doi: 10.1021/nn405998v. Epub 2013 Dec 23.

Combining single RNA sensitive probes with subdiffraction-limited and live-cell imaging enables the characterization of virus dynamics in cells

Affiliations

Combining single RNA sensitive probes with subdiffraction-limited and live-cell imaging enables the characterization of virus dynamics in cells

Eric Alonas et al. ACS Nano. .

Abstract

The creation of fluorescently labeled viruses is currently limited by the length of imaging observation time (e.g., labeling an envelope protein) and the rescue of viral infectivity (e.g., encoding a GFP protein). Using single molecule sensitive RNA hybridization probes delivered to the cytoplasm of infected cells, we were able to isolate individual, infectious, fluorescently labeled human respiratory syncytial virus virions. This was achieved without affecting viral mRNA expression, viral protein expression, or infectivity. Measurements included the characterization of viral proteins and genomic RNA in a single virion using dSTORM, the development of a GFP fusion assay, and the development of a pulse-chase assay for viral RNA production that allowed for the detection of both initial viral RNA and nascent RNA production at designated times postinfection. Live-cell measurements included imaging and characterization of filamentous virion fusion and the quantification of virus replication within the same cell over an eight-hour period. Using probe-labeled viruses, individual viral particles can be characterized at subdiffraction-limited resolution, and viral infections can be quantified in single cells over an entire cycle of replication. The implication of this development is that MTRIP labeling of viral RNA during virus assembly has the potential to become a general methodology for the labeling and study of many important RNA viruses.


Figures

Figure 1
Figure 1
Illustration of MTRIP delivery and virus isolation methodology. (A) The MTRIP design consists of 2′-O-methyl RNA/DNA oligonucleotides that are internally labeled with fluorophores (red dots with carbon linkers on deoxythymidine nucleotides) and biotinylated on the 5′ end (green dot). These oligonucleotides are tetramerized by mixing them with neutravidin (blue circle). The actual probe sequence is shown. (B) HEp-2 cells were infected with hRSV for 96 h before MTRIP probe delivery. A depiction of a cell is shown on the left, and a viral filament protruding out of the cell membrane is shown on the right. A single intergenic sequence of the hRSV genome is shown just below the filament (the ellipsis on either end of the sequence represents the additional 15kb of the hRSV genome). (C) During probe delivery, streptolysin-O is used to permeablize the cell membrane (step 1), allowing MTRIP probes to diffuse into the cell cytoplasm and bind to the intergenic sites of the hRSV genome via Watson–Crick base-pairing (step 2). (D) Streptolysin-O is removed, allowing the pores in the cell membrane to reseal and the hRSV genome/MTRIP complex to be loaded into both spherical and filamentous virion (step 1). The labeled virions are detached from the cell by scraping and can be aliquoted and frozen for further experiments (step 2).
Figure 2
Figure 2
Validation of efficient virus replication and virus morphology of MTRIP-labeled virions. (A) Cycle threshold comparisons from qRT-PCR to detect nascent hRSV P, L, and G transcripts generated from infections of HEp-2 cells using labeled or unlabeled hRSV (multiplicity of infection (MOI) 0.1 at 6, 12, and 24 h postinfection). There were no statistically significant differences at any time point for any gene (t test, n = 3, p > 0.05). (B) Representative Western blots for hRSV P and hRSV G from cells infected with labeled or unlabeled virus (MOI 0.1 at 12 and 24 h postinfection) with representative molecular weight marker and β-actin loading control. (C) Replicate Western blots were further quantified by densitometry to compare signals from labeled and unlabeled virus relative to actin loading control. There were no statistically significant differences at any time point (t test, n = 3, p > 0.05). (D) Total hRSV protein ELISA from HEp-2 cells infected with labeled or unlabeled virus (MOI 0.1 at 12 h postinfection). There were no statistically significant differences (t test, n = 3, p > 0.05). (E) Plaque assay results for labeled and unlabeled virus grown in HEp-2 cells to a saturation point at 96 h postinfection. There were no statistically significant differences (t test, n = 3, p > 0.05). (F) Thin section TEM of Vero cells infected with unlabeled virus, unlabeled virus with MTRIP probes delivered immediately before fixation, or labeled virus (MOI 0.1 at 24 h postinfection). Low-magnification fields show the pleiomorphic nature of hRSV; high-magnification fields show single filamentous virions protruding from the cell surface. Scale bars 0.5 and 0.2 μm for low- and high-magnification images, respectively.
Figure 3
Figure 3
Characterization of MTRIP-labeled hRSV virions. (A) MTRIP-labeled virions were immobilized on a coverglass, and hRSV proteins N and F were detected via immunofluorescence. A representative field of view and a magnified filamentous virion are shown. The hRSV N (green), hRSV F (blue), and labeled gRNA (red) are shown individually as well as merged. (B) Profile plot of the fluorescence intensity along the length of the filament shown in part A. (C) Dark-field images of gold-streptavidin MTRIP-labeled hRSV and neutravidin MTRIP-labeled hRSV. Samples were silver enhanced prior to imaging. Field of view is shown on the left; boxed region indicates single filament featured in the magnified image to the right. (D) Spectra of light emitted from one pixel in the single-filament image (indicated by arrow) for Au-streptavidin-labeled virus (top) or neutravidin-labeled virus (bottom). (E) Effect of varying MTRIP probe concentration on the number of objects detected on the coverglass from infected cells containing hRSV N, hRSV F, and gRNA (above, Kruskal–Wallis one-way ANOVA, * indicates p < 0.05). (F) These numbers were used to calculate a theoretical estimate of viral titer. Single-plane, wide-field deconvolved images shown in part A. Scale bars are 5 and 1 μm, respectively. Single-plane, dark-field image is shown in part C. Error bars indicate standard deviation.
Figure 4
Figure 4
dSTORM images reveal spatial relationships between viral gRNA and viral proteins. (A) Two viral filaments showing the distribution of hRSV N (red), prelabeled gRNA (green), and merged image. A side view of the filament is shown below each merged image. The yellow boxed region represents a 100 nm long cross-section through the filament; the magnified xy (top), xz (side), and yz (front) projections of the cross-section are shown to the right of the merged image. (B) Two viral filaments showing the distribution of hRSV F (red), prelabeled gRNA (green), and merged image. Side view and boxed region are similar to those in part A. (C) Table describing the measured full width at half-maximum (fwhm) of the point count of the boxed regions. Lateral fwhm derived from yz projection of the cross-section shown in the boxed region. Axial fwhm derived from xz projection of the cross-section shown in the boxed region. Scale bars are 1 μm for whole filaments and 100 nm for the boxed region.
Figure 5
Figure 5
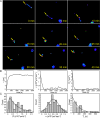
Single virion imaging reveals dynamic, largely diffusive behavior for MTRIP-labeled filamentous virions infecting cells. Cells were inoculated with MTRIP-labeled virions at 4 °C before live-cell imaging at 37 °C. (A) Frames from a typical live-cell video, acquired at 1 frame/min over the course of 40 min. Arrow indicates the end of the filamentous virion that was monitored via single-particle tracking. (B) Absolute displacement (from the position at t = 0 min), instantaneous velocity, and square of the radius of gyration over time for the virion shown in part A. (C) Histograms of the diffusion coefficient during passive states (left), instantaneous velocity for active states (center), and temporal duration of active states (right) for 15 individual filamentous virions over two different experiments. Black line indicates log-normal fit, Gaussian fit, and exponential decay fit, respectively. Single-plane, wide-field deconvolved images are shown.
Figure 6
Figure 6
MTRIP-labeled hRSV virions can be used to follow the same cell over the course of an infection. HEp-2 cells were plated onto a patterned fibronectin substrate and infected with MTRIP-labeled hRSV. (A) Phase and fluorescence images for two different cells over an eight-hour period with prelabeled gRNA (red), newly produced gRNA (green), and cell nuclei (blue). (B) Mean fluorescence volume per puncta of the newly produced gRNA over the three time points. (C) Fluorescence intensity per volume of the newly produced gRNA over the three time points. (D) Number of newly produced gRNA puncta per cell over the three time points. One-way repeated measures ANOVA with Tukey test multiple comparison procedure; * indicates p < 0.05.

Similar articles

Cited by

References

    1. Lehmann M. J.; Sherer N. M.; Marks C. B.; Pypaert M.; Mothes W. Actin- and Myosin-Driven Movement of Viruses along Filopodia Precedes Their Entry into Cells. J. Cell Biol. 2005, 170, 317–325. - PMC - PubMed
    1. Brandenburg B.; Lee L. Y.; Lakadamyali M.; Rust M. J.; Zhuang X.; Hogle J. M. Imaging Poliovirus Entry in Live Cells. PLoS Biol 2007, 5, e183. - PMC - PubMed
    1. Coller K. E.; Berger K. L.; Heaton N. S.; Cooper J. D.; Yoon R.; Randall G. RNA Interference and Single Particle Tracking Analysis of Hepatitis C Virus Endocytosis. PLoS Pathog. 2009, 5, e1000702. - PMC - PubMed
    1. Lakadamyali M.; Rust M. J.; Babcock H. P.; Zhuang X. Visualizing Infection of Individual Influenza Viruses. Proc. Natl. Acad. Sci. U.S.A. 2003, 100, 9280–9285. - PMC - PubMed
    1. van der Schaar H. M.; Rust M. J.; Chen C.; van der Ende-Metselaar H.; Wilschut J.; Zhuang X.; Smit J. M. Dissecting the Cell Entry Pathway of Dengue Virus by Single-Particle Tracking in Living Cells. PLoS Pathog. 2008, 4, e1000244. - PMC - PubMed

Publication types