MicroRNA319a-targeted Brassica rapa ssp. pekinensis TCP genes modulate head shape in chinese cabbage by differential cell division arrest in leaf regions
- PMID: 24351684
- PMCID: PMC3912100
- DOI: 10.1104/pp.113.228007
MicroRNA319a-targeted Brassica rapa ssp. pekinensis TCP genes modulate head shape in chinese cabbage by differential cell division arrest in leaf regions
Abstract
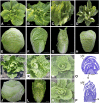
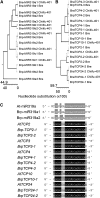
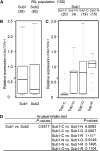
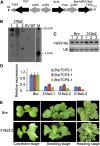
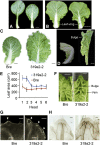
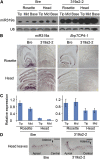
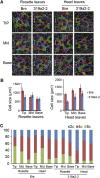
Leafy heads of cabbage (Brassica oleracea), Chinese cabbage (Brassica rapa), and lettuce (Lactuca sativa) are composed of extremely incurved leaves. The shape of these heads often dictates the quality, and thus the commercial value, of these crops. Using quantitative trait locus mapping of head traits within a population of 150 recombinant inbred lines of Chinese cabbage, we investigated the relationship between expression levels of microRNA-targeted Brassica rapa ssp. pekinensis TEOSINTE BRANCHED1, cycloidea, and PCF transcription factor4 (BrpTCP4) genes and head shape. Here, we demonstrate that a cylindrical head shape is associated with relatively low BrpTCP4-1 expression, whereas a round head shape is associated with high BrpTCP4-1 expression. In the round-type Chinese cabbage, microRNA319 (miR319) accumulation and BrpTCP4-1 expression decrease from the apical to central regions of leaves. Overexpression of BrpMIR319a2 reduced the expression levels of BrpTCP4 and resulted in an even distribution of BrpTCP4 transcripts within all leaf regions. Changes in temporal and spatial patterns of BrpTCP4 expression appear to be associated with excess growth of both apical and interveinal regions, straightened leaf tips, and a transition from the round to the cylindrical head shape. These results suggest that the miR319a-targeted BrpTCP gene regulates the round shape of leafy heads via differential cell division arrest in leaf regions. Therefore, the manipulation of miR319a and BrpTCP4 genes is a potentially important tool for use in the genetic improvement of head shape in these crops.
Figures
Similar articles
-
BrpSPL9 (Brassica rapa ssp. pekinensis SPL9) controls the earliness of heading time in Chinese cabbage.Plant Biotechnol J. 2014 Apr;12(3):312-21. doi: 10.1111/pbi.12138. Epub 2013 Nov 15. Plant Biotechnol J. 2014. PMID: 24237584
-
Genome-Wide Identification and Analysis of TCP Transcription Factors Involved in the Formation of Leafy Head in Chinese Cabbage.Int J Mol Sci. 2018 Mar 14;19(3):847. doi: 10.3390/ijms19030847. Int J Mol Sci. 2018. PMID: 29538304 Free PMC article.
-
Molecular characterization and transcriptome analysis of orange head Chinese cabbage (Brassica rapa L. ssp. pekinensis).Planta. 2015 Jun;241(6):1381-94. doi: 10.1007/s00425-015-2262-z. Epub 2015 Feb 17. Planta. 2015. PMID: 25686795
-
Physiological Control and Genetic Basis of Leaf Curvature and Heading in Brassica rapa L.J Adv Res. 2023 Nov;53:49-59. doi: 10.1016/j.jare.2022.12.010. Epub 2022 Dec 26. J Adv Res. 2023. PMID: 36581197 Free PMC article. Review.
-
Gene co-expression network analysis reveals key pathways and hub genes in Chinese cabbage (Brassica rapa L.) during vernalization.BMC Genomics. 2021 Apr 6;22(1):236. doi: 10.1186/s12864-021-07510-8. BMC Genomics. 2021. PMID: 33823810 Free PMC article. Review.
Cited by
-
High-throughput sequencing of small RNAs and anatomical characteristics associated with leaf development in celery.Sci Rep. 2015 Jun 9;5:11093. doi: 10.1038/srep11093. Sci Rep. 2015. PMID: 26057455 Free PMC article.
-
Genetic analysis of the "head top shape" quality trait of Chinese cabbage and its association with rosette leaf variation.Hortic Res. 2021 May 1;8(1):106. doi: 10.1038/s41438-021-00541-y. Hortic Res. 2021. PMID: 33931629 Free PMC article.
-
Genetic Analysis of Chinese Cabbage Reveals Correlation Between Rosette Leaf and Leafy Head Variation.Front Plant Sci. 2018 Oct 4;9:1455. doi: 10.3389/fpls.2018.01455. eCollection 2018. Front Plant Sci. 2018. PMID: 30337935 Free PMC article.
-
BrKAO2 mutations disrupt leafy head formation in Chinese cabbage (Brassica rapa L. ssp. pekinensis).Theor Appl Genet. 2022 Jul;135(7):2453-2468. doi: 10.1007/s00122-022-04126-8. Epub 2022 Jun 21. Theor Appl Genet. 2022. PMID: 35726066
-
Transcriptomic analyses to summarize gene expression patterns that occur during leaf initiation of Chinese cabbage.Hortic Res. 2024 Feb 28;11(4):uhae059. doi: 10.1093/hr/uhae059. eCollection 2024 Apr. Hortic Res. 2024. PMID: 38689699 Free PMC article.
References
-
- Aggarwal P, Padmanabhan B, Bhat A, Sarvepalli K, Sadhale PP, Nath U. (2011) The TCP4 transcription factor of Arabidopsis blocks cell division in yeast at G1→S transition. Biochem Biophys Res Commun 410: 276–281 - PubMed
-
- Aldrich J, Cullis CA. (1993) RAPD analysis in flax: optimization of yield and reproducibility using KlenTaq 1 DNA polymerase, Chelex 100, and gel purification of genomic DNA. Plant Mol Biol Rep 11: 128–141
-
- Andriankaja M, Dhondt S, De Bodt S, Vanhaeren H, Coppens F, De Milde L, Mühlenbock P, Skirycz A, Gonzalez N, Beemster GT, et al. (2012) Exit from proliferation during leaf development in Arabidopsis thaliana: a not-so-gradual process. Dev Cell 22: 64–78 - PubMed
-
- Ausubel FH, Brent R, Kingston RE, Moore DD, Seidman JG, Smith JA, Struhl K. (1994) Current Protocols in Molecular Biology. John Wiley & Sons, Hoboken, NJ
-
- Bai J, Wu F, Mao Y, He Y (2013) In planta transformation of Brassica rapa and B. napus via vernalization-infiltration methods. Protocol Exchange, http://www.nature.com/protocolexchange/protocols/2769 (August 7, 2013)
Publication types
MeSH terms
Substances
Associated data
- Actions
LinkOut - more resources
Full Text Sources
Other Literature Sources

