. 2014 Feb;164(2):1011-27.
doi: 10.1104/pp.113.230714. Epub 2013 Dec 18.

MicroRNA156: a potential graft-transmissible microRNA that modulates plant architecture and tuberization in Solanum tuberosum ssp. andigena

Affiliations

MicroRNA156: a potential graft-transmissible microRNA that modulates plant architecture and tuberization in Solanum tuberosum ssp. andigena

Sneha Bhogale et al. Plant Physiol. 2014 Feb.

Abstract

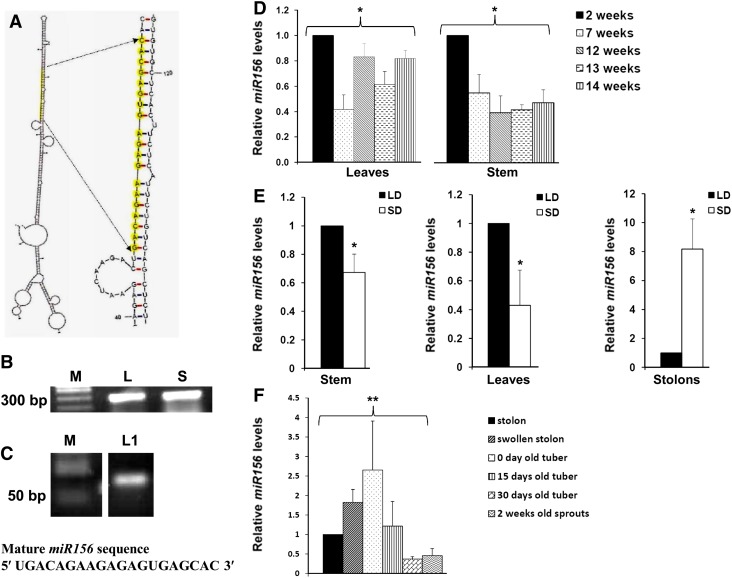
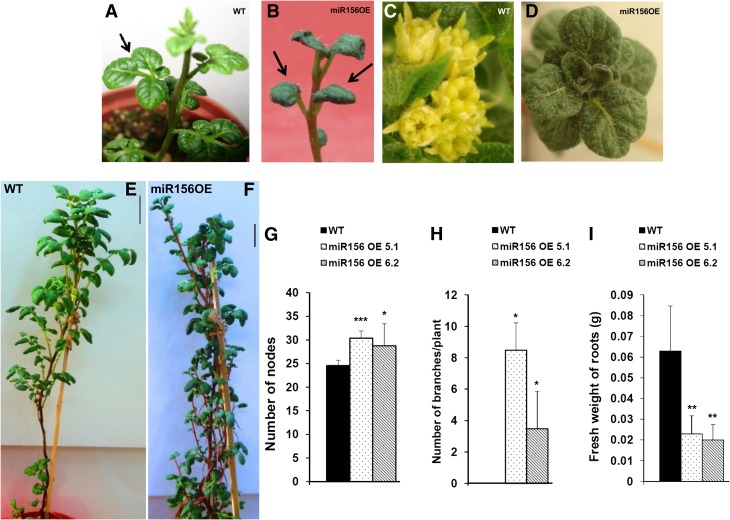
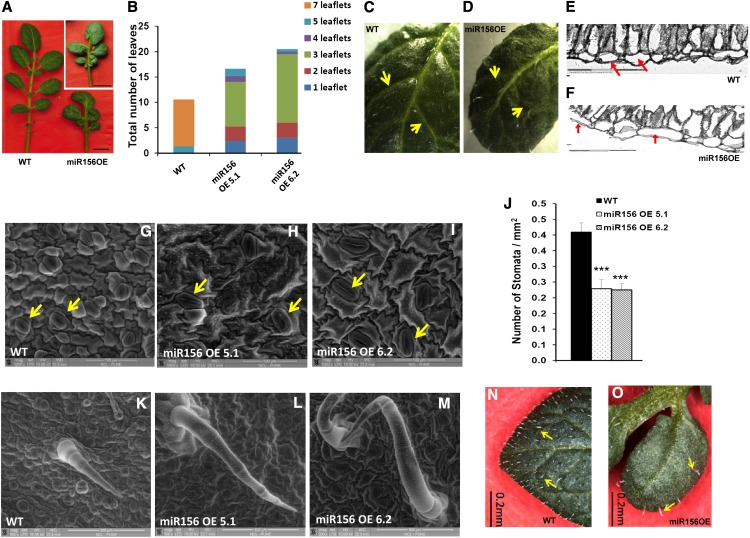
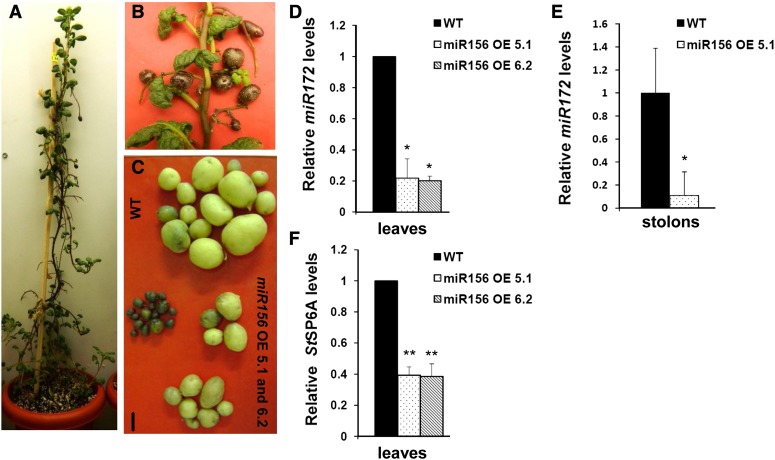
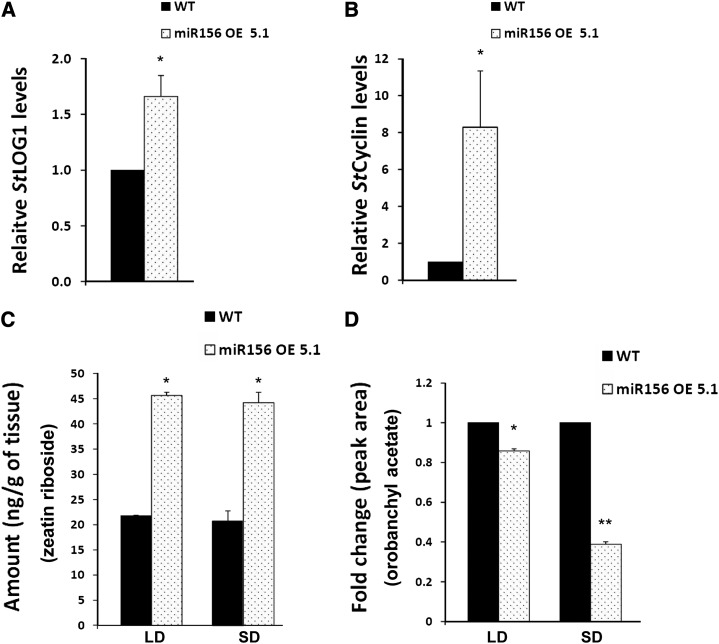
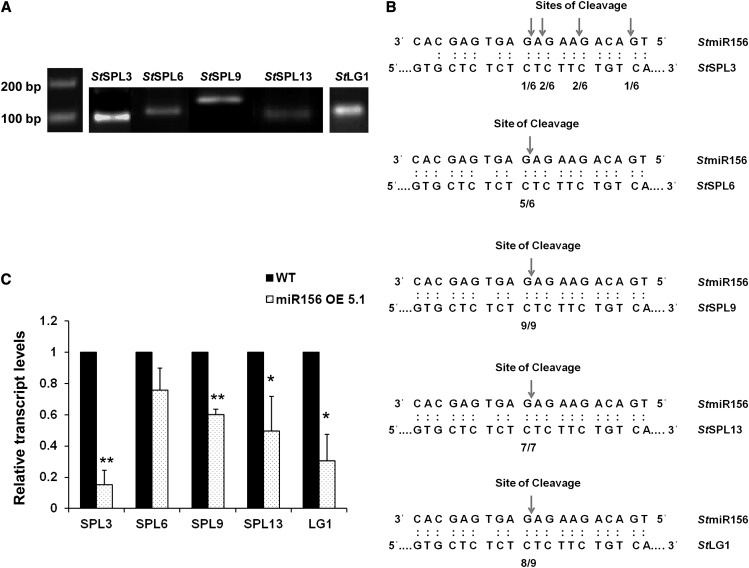
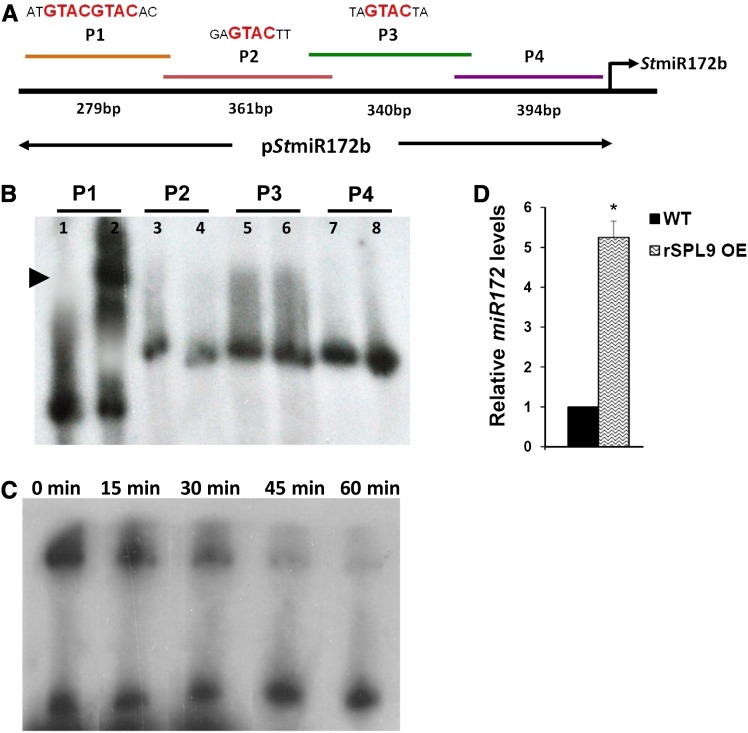
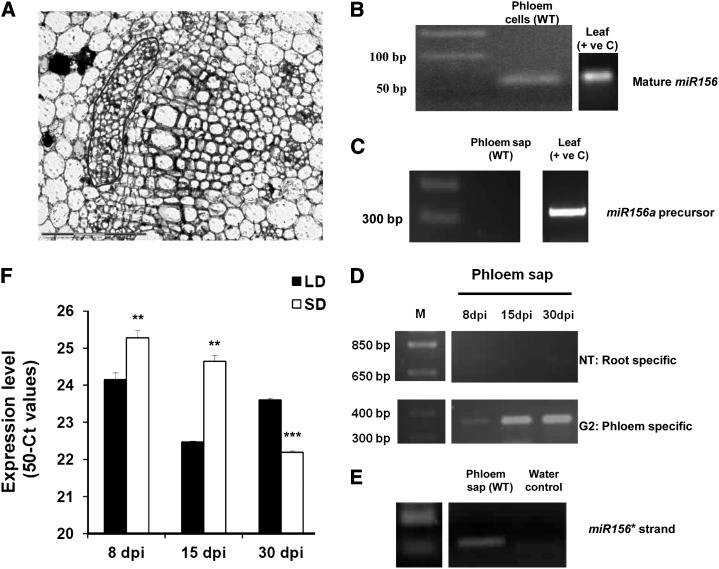
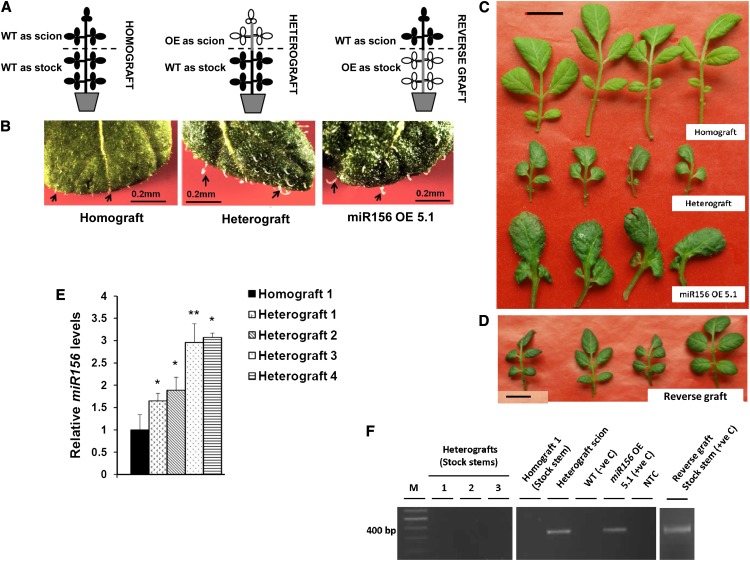
MicroRNA156 (miR156) functions in maintaining the juvenile phase in plants. However, the mobility of this microRNA has not been demonstrated. So far, only three microRNAs, miR399, miR395, and miR172, have been shown to be mobile. We demonstrate here that miR156 is a potential graft-transmissible signal that affects plant architecture and tuberization in potato (Solanum tuberosum). Under tuber-noninductive (long-day) conditions, miR156 shows higher abundance in leaves and stems, whereas an increase in abundance of miR156 has been observed in stolons under tuber-inductive (short-day) conditions, indicative of a photoperiodic control. Detection of miR156 in phloem cells of wild-type plants and mobility assays in heterografts suggest that miR156 is a graft-transmissible signal. This movement was correlated with changes in leaf morphology and longer trichomes in leaves. Overexpression of miR156 in potato caused a drastic phenotype resulting in altered plant architecture and reduced tuber yield. miR156 overexpression plants also exhibited altered levels of cytokinin and strigolactone along with increased levels of LONELY GUY1 and StCyclin D3.1 transcripts as compared with wild-type plants. RNA ligase-mediated rapid amplification of complementary DNA ends analysis validated SQUAMOSA PROMOTER BINDING-LIKE3 (StSPL3), StSPL6, StSPL9, StSPL13, and StLIGULELESS1 as targets of miR156. Gel-shift assays indicate the regulation of miR172 by miR156 through StSPL9. miR156-resistant SPL9 overexpression lines exhibited increased miR172 levels under a short-day photoperiod, supporting miR172 regulation via the miR156-SPL9 module. Overall, our results strongly suggest that miR156 is a phloem-mobile signal regulating potato development.


Figures

Figure 1.
Figure 1.
Identification, validation, and expression analysis of miR156 in potato. A, Secondary structure of miR156a precursor as predicted by MFold (Zuker, 2003). Mature miR156 sequence is highlighted in yellow. B, RT-PCR of miR156a precursor from leaf (L) and shoot (S). M represents a DNA marker. C, Stem-loop RT-PCR of mature miR156 from leaves of LD-grown plants (L1). D, Age-specific miR156 abundance in leaves and stem of wild-type potato grown under LD photoperiod. Error bars indicate sd of two biological replicates each with three technical replicates. Asterisks indicate one-factor ANOVA (*P < 0.05). E, miR156 abundance in stem, leaves, and stolons of wild-type potato grown under LD and SD photoperiods for 15 dpi. Error bars indicate sd of three biological replicates each with three technical replicates. Asterisks indicate Student’s t test (*P < 0.05). F, Relative abundance of miR156 in different developmental stages of tuber formation and dormancy. Error bars indicate sd of three biological replicates each with three technical replicates. Asterisks indicate one-factor ANOVA (**P < 0.01). [See online article for color version of this figure.]
Figure 2.
Figure 2.
Overexpression of miR156 affects multiple morphological traits in potato. A and B, Two-week-old plants of the wild type (WT; A) and miR156 OE 5.1 (B). C and D, Inflorescence produced at the apical tip of 12-week-old wild-type potato plants (C), while miR156 OE 5.1 plants of the same age produced leaves (D). E and F, Twelve-week-old plants of wild-type (E) and miR156 OE 5.1 (F) lines of potato. Bars = 5 cm. G to I, Number of nodes (G; n = 5), number of axillary branches (H; n = 4), and fresh weight of roots (I; n = 6) of wild-type and miR156 OE plants. Error bars indicate sd. Asterisks indicate statistical differences as determined using Student’s t test (***P < 0.001, **P < 0.01, *P < 0.05). [See online article for color version of this figure.]
Figure 3.
Figure 3.
Effect of miR156 overexpression on leaf development of potato. A, Leaves of 8-week-old wild-type (WT) and miR156 OE 5.1 and 6.2 (inset) plants. Bars = 1 cm. B, Distribution of the number of leaflets per leaf in 8-week-old wild-type and miR156 OE 5.1 and 6.2 plants. C and D, Venation pattern of wild-type leaf (C) and miR156 OE 5.1 leaf (D). Arrows indicate veins. E and F, Transverse sections of leaves (20×) of wild-type (E) and miR156 OE 5.1 (F) plants showing differences in leaf architecture. The epidermal cells are marked by arrows. G to I, eSEM images of the leaf surface showing differences in the size of epidermal cells and stomata (marked by arrows) for wild-type (G) and miR156 OE 5.1 (H) and miR156 OE 6.2 (I) plants. Bars = 100 μm. J, Stomatal density of wild-type and miR156 OE 5.1 and 6.2 plants (n = 5). Error bars indicate sd. Asterisks indicate statistical differences as determined using Student’s t test (***P < 0.001). K to M, eSEM images of trichomes for wild-type (K) and miR156 OE 5.1 (L) and miR156 OE 6.2 (M) plants. Bars = 300 μm. N and O, Trichome phenotype of wild-type leaf (N) and miR156 OE 5.1 leaf (O). Bars = 0.2 mm. [See online article for color version of this figure.]
Figure 4.
Figure 4.
miR156 regulates potato tuberization. A, miR156 OE 5.1 plant incubated for 30 d under SD conditions. B, Aerial tubers developed on miR156 OE 5.1. C, Tubers of representative wild-type (WT) and miR156 OE line 5.1 and 6.2 plants. Bar = 1 cm. D to F, Levels of tuberization markers: miR172 in 8-d post SD-induced leaves of wild-type and miR156 OE line 5.1 and 6.2 plants (D); miR172 in 15-d post SD-induced stolons of wild-type and miR156 OE line 5.1 plants (E); and StSP6A in 8-d post SD-induced leaves of wild-type and miR156 OE line 5.1 and 6.2 plants (F). For miR172 in leaves (D), error bars indicate sd of two biological replicates each with three technical replicates; for miR172 in stolons (E; 15 dpi in SD conditions), error bars indicate sd of one biological replicate with three technical replicates; for StSP6A (F), semiquantitative analysis was performed with three independent replicates. Error bars indicate sd of three replicates. Asterisks indicate statistical differences as determined using Student’s t test (*P < 0.05, **P < 0.01). [See online article for color version of this figure.]
Figure 5.
Figure 5.
Zeatin riboside and orobanchyl acetate levels are affected by miR156 overexpression. A and B, qRT-PCR analysis of StLOG1 (A) and StCyclin D3.1 (B) in axillary meristems of wild-type (WT) and miR156 OE 5.1 plants incubated for 15 d under SD conditions. Error bars indicate sd of three biological replicates each with three technical replicates. Asterisks indicate statistical differences as determined using Student’s t test (*P < 0.05). C and D, HR-MS analysis of wild-type and miR156 OE 5.1 plants for zeatin riboside (C) and orobanchyl acetate (D). The tissues were axillary meristems of wild-type and miR156 OE 5.1 plants incubated for 15 d under both SD and LD conditions. Error bars indicate sd of two biological replicates. Asterisks indicate statistical differences as determined using Student’s t test (*P < 0.05, **P < 0.01).
Figure 6.
Figure 6.
miR156 targets in potato. A and B, miR156 cleavage site mapping in miR156 targets as determined by modified RLM-RACE. A, Nested PCR products were cloned and sequenced. B, Frequency of 5′ RACE clones showing cleavage site (arrows) and fractions indicating proportions of clones showing these cleavage sites. C, Expression pattern of StSPL3, StSPL6, StSPL9, StSPL13, and StLG1 in wild-type (WT) and miR156 OE 5.1 plants by qRT-PCR. Error bars indicate sd of three biological replicates each with three technical replicates. Asterisks indicate statistical differences as determined using Student’s t test (*P < 0.05, **P < 0.01).
Figure 7.
Figure 7.
StSPL9 binds to the StMIR172b promoter. A, Schematic representation of StMIR172b promoter sequence showing SPL binding motifs and lengths of four fragments. B, Gel retardation assay of StMIR172b promoter fragments P1 to P4 with StSPL9. The lanes are alternate for free probe and probe + protein. C, Cold competition retardation assay of P1 with StSPL9. Labeled P1 was incubated with StSPL9 for 30 min at 25°C, and then a 100-fold molar excess of unlabeled P1 was added and aliquots were analyzed after the indicated times (0–60 min). D, Relative levels of miR172 in 15-d post SD-induced leaves of wild-type (WT) and rSPL9 OE plants. Error bars indicate sd of two biological replicates each with three technical replicates. The asterisk indicates a statistical difference as determined using Student’s t test (*P < 0.05). [See online article for color version of this figure.]
Figure 8.
Figure 8.
Detection of miR156 in phloem. A, Phloem tissue in a wild-type stem section (marked in red). This tissue was harvested by LMPC. B, Detection of miR156 (mature) in phloem of wild-type plants (WT) and leaf tissue of wild-type plants (positive control [+ ve C]) by stem-loop RT-PCR. C, Absence of miR156a precursor (300 bp) in wild-type phloem sap and its presence in wild-type leaf, acting as a positive control, by RT-PCR analysis. D, RT-PCR analysis of nitrate transporter (NT; root-specific transcript) and G2-like transcription factor (G2; phloem-specific transcript) of potato phloem sap of the wild type (phloem-enriched exudate) to assess its purity (Banerjee et al., 2006a). E, Detection of the miR156* strand in phloem sap of the wild type by stem-loop RT-PCR. F, Differential accumulation of miR156 (mature) under SD and LD photoperiods in phloem sap of wild-type plants harvested after 8, 15, and 30 dpi. miR156 accumulation is plotted as 50 minus Ct (for cycle threshold; 50-Ct) values as described previously (Pant et al., 2008). Error bars indicate sd of one biological replicate with three technical replicates. Asterisks indicate statistical differences as determined using Student’s t test (**P < 0.01, ***P < 0.001).
Figure 9.
Figure 9.
miR156 is a potential graft-transmissible signal. A, Pictorial representation of the grafts. WT, Wild type. B, Trichomes of homograft (stock leaves), heterograft (stock leaves), and leaves from miR156 OE 5.1 plants, where trichomes in heterografts (stock leaves) are less in number and more in length, as observed for miR156 OE 5.1 plants. Bars = 0.2 mm. C and D, Leaves of homograft (stock), heterograft (stock), miR156 OE 5.1 plants, and reverse grafts (scion), where heterograft stock leaves mimic the phenotype of miR156 OE 5.1 leaves (C), while reverse graft scion leaves mimic the phenotype of homograft leaves (stock; D) Bars = 1 cm. E, Relative levels of mature miR156 in stock stems of four representative heterografts (1–4) and homograft incubated under SD conditions and harvested after 30 dpi were measured by stem-loop qRT-PCR. Error bars indicate sd of one biological replicate with three technical replicates. Asterisks indicate statistical differences as determined using Student’s t test (*P < 0.05, **P < 0.01). F, Detection of miR156a precursor transgene in stock stems of homograft, three representative heterografts (1–3), and reverse graft by RT-PCR analysis. Stem tissue of heterograft scion, reverse graft stock, and a miR156 OE 5.1 plant served as positive controls (+ve C), with the wild type as a negative control (−ve C). NTC, No template control. [See online article for color version of this figure.]

Similar articles

Cited by

References

    1. Atkins CA, Smith PMC, Rodriguez-Medina C. (2011) Macromolecules in phloem exudates: a review. Protoplasma 248: 165–172 - PubMed
    1. Axtell MJ, Bowman JL. (2008) Evolution of plant microRNAs and their targets. Trends Plant Sci 13: 343–349 - PubMed
    1. Banerjee AK, Chatterjee M, Yu Y, Suh SG, Miller WA, Hannapel DJ. (2006a) Dynamics of a mobile RNA of potato involved in a long-distance signaling pathway. Plant Cell 18: 3443–3457 - PMC - PubMed
    1. Banerjee AK, Prat S, Hannapel DJ. (2006b) Efficient production of transgenic potato (S. tuberosum L. ssp. andigena) plants via Agrobacterium tumefaciens-mediated transformation. Plant Sci 170: 732–738
    1. Birkenbihl RP, Jach G, Saedler H, Huijser P. (2005) Functional dissection of the plant-specific SBP-domain: overlap of the DNA-binding and nuclear localization domains. J Mol Biol 352: 585–596 - PubMed

Publication types

MeSH terms

LinkOut - more resources