. 2013 Dec 17;14(12):24560-80.
doi: 10.3390/ijms141224560.

Towards lipidomics of low-abundant species for exploring tumor heterogeneity guided by high-resolution mass spectrometry imaging

Affiliations

Towards lipidomics of low-abundant species for exploring tumor heterogeneity guided by high-resolution mass spectrometry imaging

Jonathan Cimino et al. Int J Mol Sci. .

Abstract

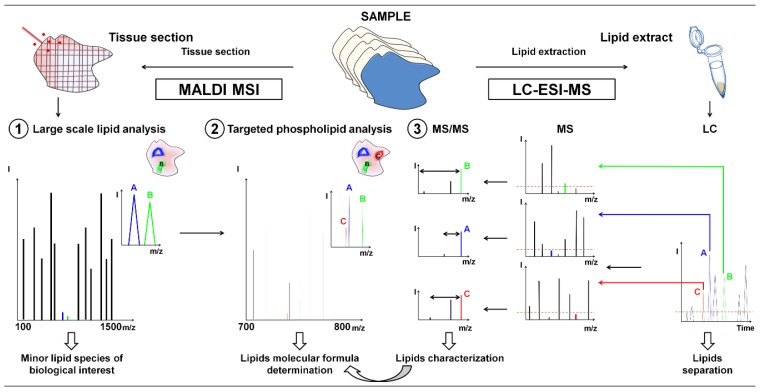
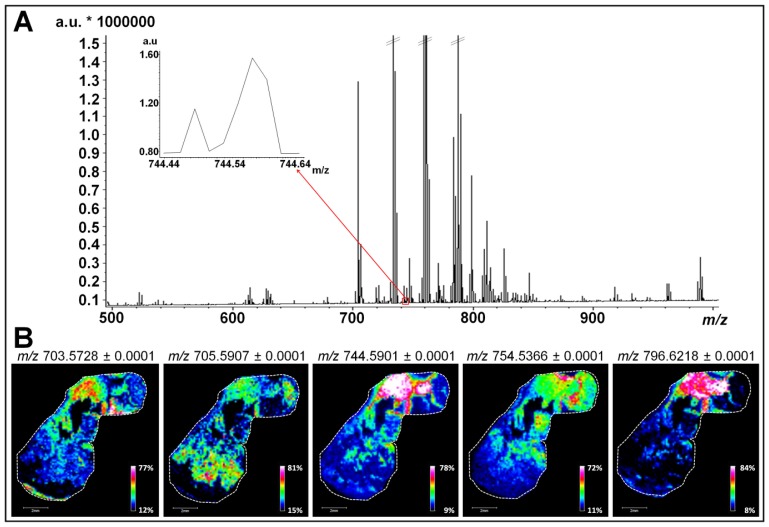
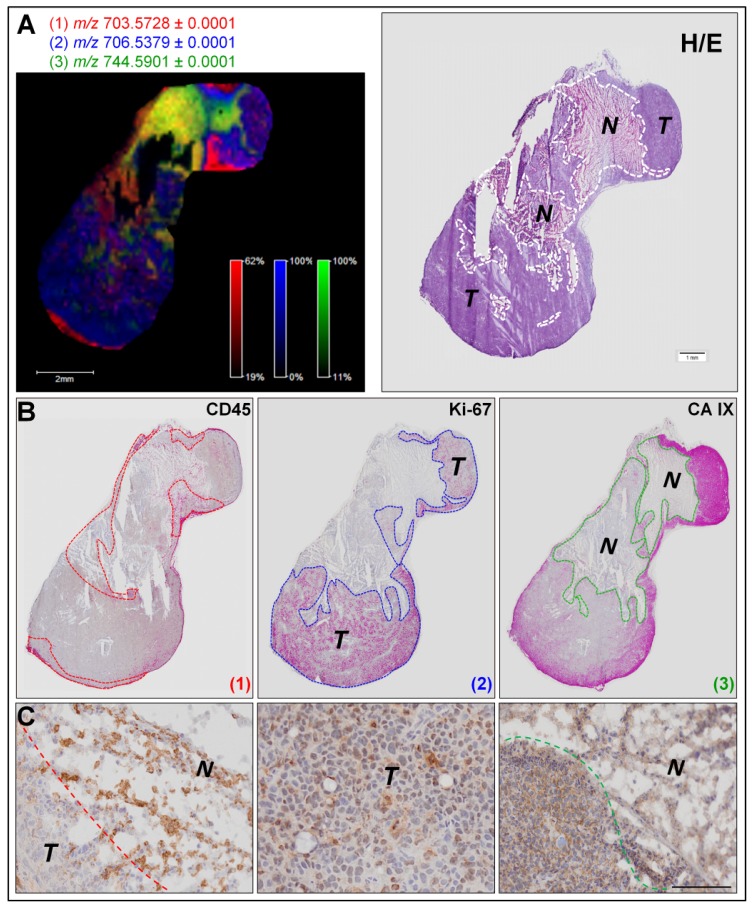
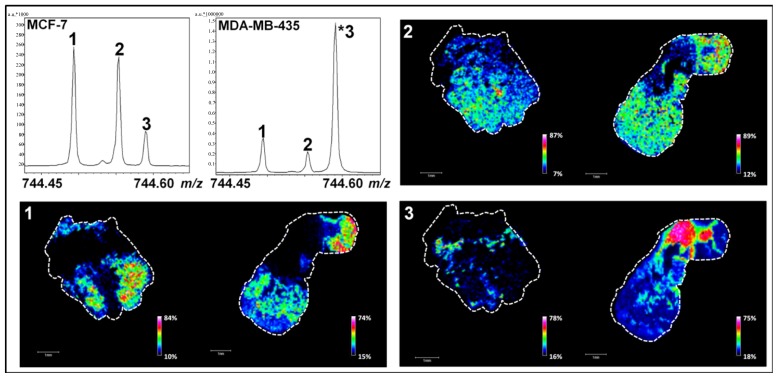
Many studies have evidenced the main role of lipids in physiological and also pathological processes such as cancer, diabetes or neurodegenerative diseases. The identification and the in situ localization of specific low-abundant lipid species involved in cancer biology are still challenging for both fundamental studies and lipid marker discovery. In this paper, we report the identification and the localization of specific isobaric minor phospholipids in human breast cancer xenografts by FTICR MALDI imaging supported by histochemistry. These potential candidates can be further confirmed by liquid chromatography coupled with electrospray mass spectrometry (LC-ESI-MS) after extraction from the region of interest defined by MALDI imaging. Finally, this study highlights the importance of characterizing the heterogeneous distribution of low-abundant lipid species, relevant in complex histological samples for biological purposes.


Figures

Figure 1.
Figure 1.
General workflow for the characterization by LC-ESI-MS guided by MALDI MSI of low-abundant lipids in tissue using FTICR mass spectrometry. (1) Large scale lipid analysis by MALDI MSI to target lipids of biological relevance after comparison with histochemical staining; (2) Targeted MALDI MSI analysis and molecular formula determination by exact mass measurement; and (3) LC-ESI-MS analyses for the characterization of low-abundant PL classes from lipid extracts.
Figure 2.
Figure 2.
Large scale lipid analysis by MALDI MSI for low-abundant lipids of biological relevance targeting. (A) Broadband average mass spectrum of a simultaneous MALDI MSI analysis on sections of tumors derived from MCF-7, MDA-MB-231, and MDA-MB-435 cells. Inset indicates molecular species in a mass range comprised between m/z 744.44 and 744.64 considered for lipid mapping; and (B) MALDI MSI ion image representing the repartition of five low-abundant PLs (m/z 703.5728, m/z 705.5907, m/z 744.5901, m/z 754.5366 and m/z 796.6218) in a MDA-MB-435 tissue section (scale bars, 2 mm).
Figure 3.
Figure 3.
Determination of low-abundant PL species associated with different tumor compartments by correlation between MALDI MSI data and histochemical stainings. (A) MALDI MSI ion image representing the localization of three PLs (m/z values of 703.5728 in red, 706.5379 in blue, and 744.5901 in green) in a section of tumor induced by MDA-MB-435 cells (right panel) and hematoxylin/eosin staining (left panel). Dotted lines on the hematoxylin/eosin stained section image delineate necrosis “N” and tumor “T” areas; (B) Binary images of CD45 (left panel), Ki-67 (central panel) and CA IX (right panel) immunostainings of MDA-MB-435 serial tissue sections. Dotted lines of each binary image delineate the localization of PL (1) (m/z 703.5728 in red); PL (2) (m/z 706.5379 in blue) and PL (3) (m/z 744.5901 in green) shown in ion image. Squares indicate positions of high magnification microscopy images of immunohistochemistry (C); and (C) High magnification microscopy images of immunohistochemistry for CD45 (left), Ki-67 (middle) and CA IX (right) immunostainings (scale bars, 500 μm).
Figure 4.
Figure 4.
MALDI MSI analyses of MCF-7 (to the left) and MDA-MB-435 (to the right) tumor sections in narrowband mode. Associated ion images represent the localization of low-abundant PLs with m/z 744.49419 (peak 1), m/z 744.55385 (peak 2) and m/z 744.59019 (peak 3). PL relative contents determined by LC-ESI-MS are available in Table S3 (scale bars, 1 mm).
Figure 5.
Figure 5.
LC-ESI-MS analyses of lipid extracts from MCF-7 and MDA-MB-435 tissues. (A) Total ion currents (TIC) of LC-ESI-MS analyses. Insets show the extract ion currents ranging from m/z 744 to 745; and (B)–(D): Exact mass measurements acquired with the FTICR analyzer. Insets show MS/MS spectra at respective retention times. The visualization of an ion at m/z 184 indicates that the PL is a PC. Neutral loss fragment of 141 Da indicates that the PL is a PE.

References

    1. Shevchenko A., Simons K. Lipidomics: Coming to grips with lipid diversity. Nat. Rev. 2010;11:593–598. - PubMed
    1. Kasson P.M., Pande V.S. Control of membrane fusion mechanism by lipid composition: Predictions from ensemble molecular dynamics. PLoS Comput. Boil. 2007;3:e220. - PMC - PubMed
    1. Aguilar P.S., Heiman M.G., Walther T.C., Engel A., Schwudke D., Gushwa N., Kurzchalia T., Walter P. Structure of sterol aliphatic chains affects yeast cell shape and cell fusion during mating. Proc. Natl. Acad. Sci. USA. 2010;107:4170–4175. - PMC - PubMed
    1. Fujimoto K., Iwasaki C., Kawaguchi H., Yasugi E., Oshima M. Cell membrane dynamics and the induction of apoptosis by lipid compounds. FEBS Lett. 1999;446:113–116. - PubMed
    1. Johansen J., Ramanathan V., Beh C.T. Vesicle trafficking from a lipid perspective: Lipid regulation of exocytosis in Saccharomyces cerevisiae. Cell. Logist. 2012;2:151–160. - PMC - PubMed

Publication types