

The antidiabetic drug metformin inhibits the proliferation of bladder cancer cells in vitro and in vivo
- PMID: 24351837
- PMCID: PMC3876131
- DOI: 10.3390/ijms141224603
The antidiabetic drug metformin inhibits the proliferation of bladder cancer cells in vitro and in vivo
Abstract
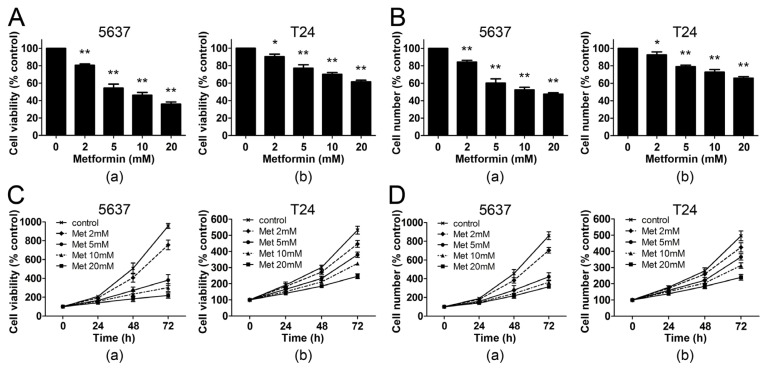
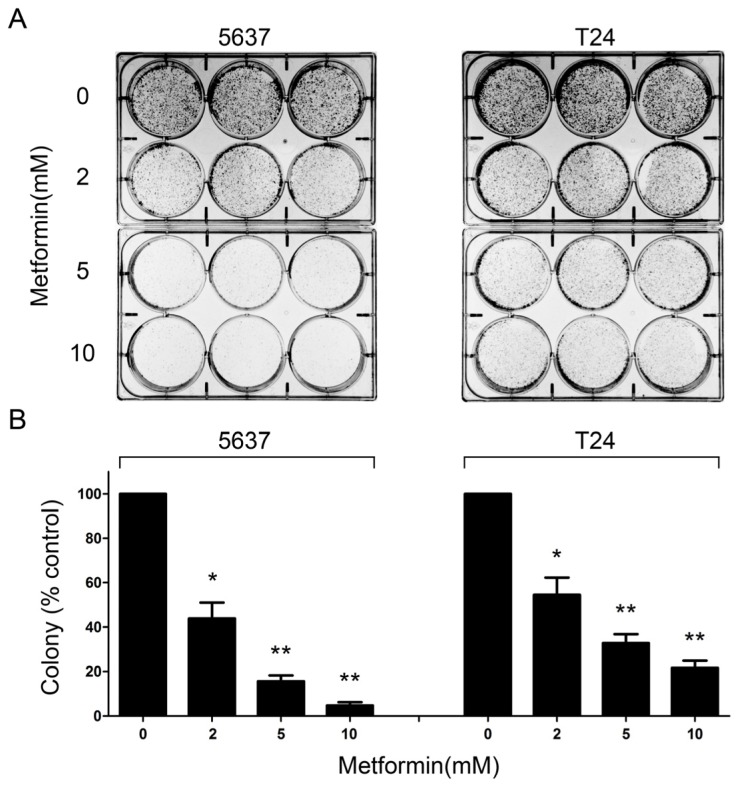
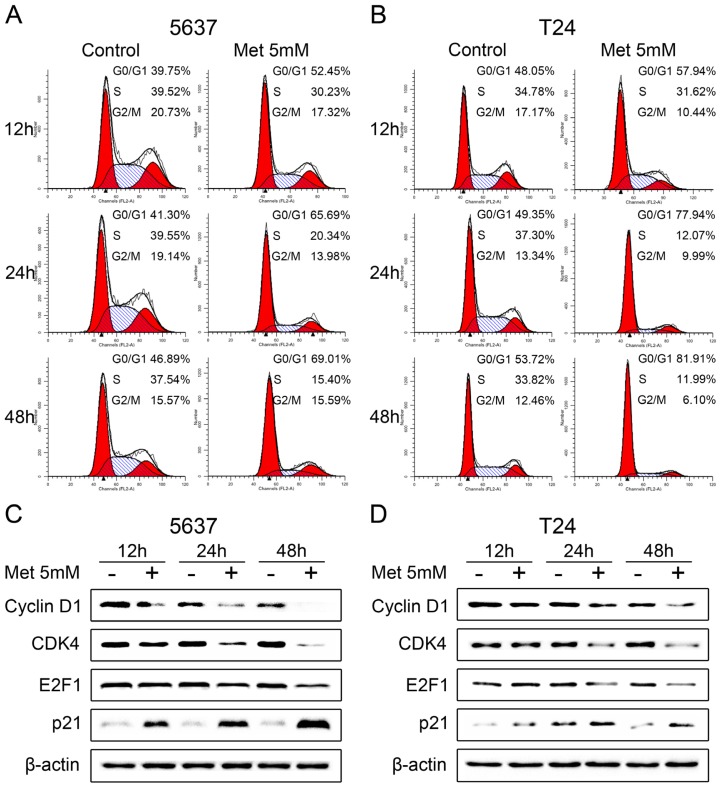
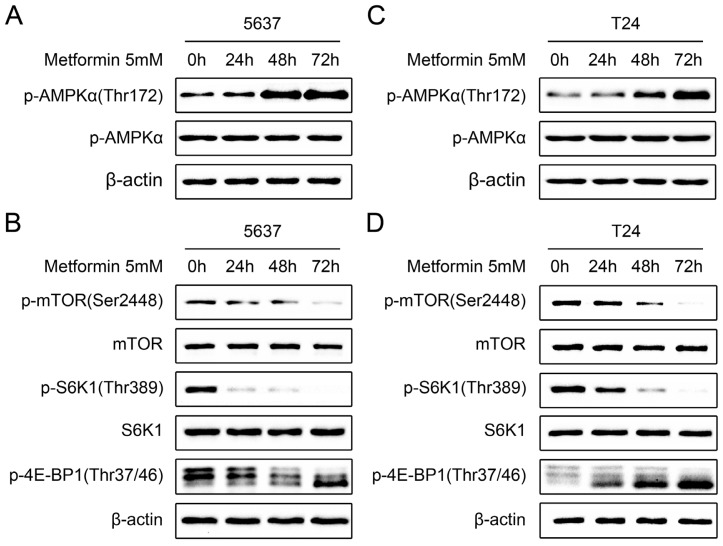
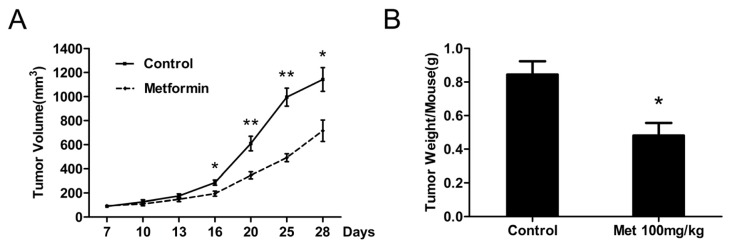
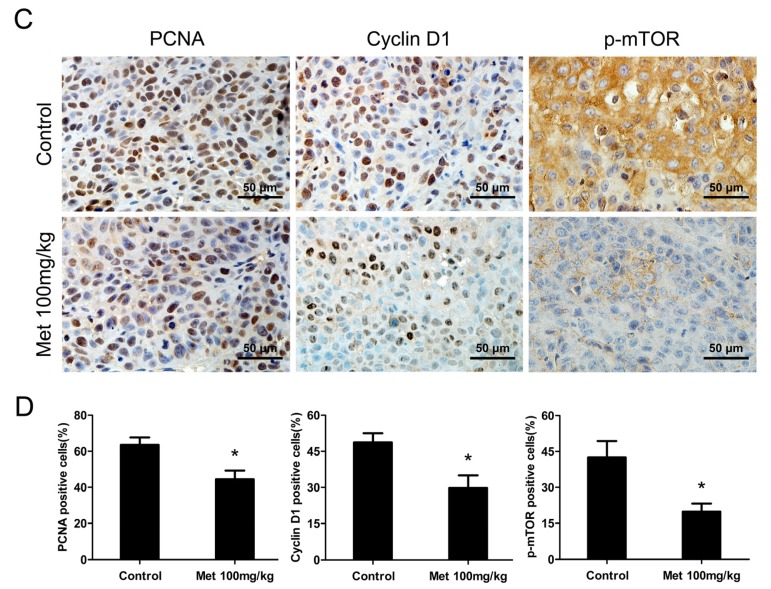
Recent studies suggest that metformin, a widely used antidiabetic agent, may reduce cancer risk and improve prognosis of certain malignancies. However, the mechanisms for the anti-cancer effects of metformin remain uncertain. In this study, we investigated the effects of metformin on human bladder cancer cells and the underlying mechanisms. Metformin significantly inhibited the proliferation and colony formation of 5637 and T24 cells in vitro; specifically, metformin induced an apparent cell cycle arrest in G0/G1 phases, accompanied by a strong decrease of cyclin D1, cyclin-dependent kinase 4 (CDK4), E2F1 and an increase of p21waf-1. Further experiments revealed that metformin activated AMP-activated protein kinase (AMPK) and suppressed mammalian target of rapamycin (mTOR), the central regulator of protein synthesis and cell growth. Moreover, daily treatment of metformin led to a substantial inhibition of tumor growth in a xenograft model with concomitant decrease in the expression of proliferating cell nuclear antigen (PCNA), cyclin D1 and p-mTOR. The in vitro and in vivo results demonstrate that metformin efficiently suppresses the proliferation of bladder cancer cells and suggest that metformin may be a potential therapeutic agent for the treatment of bladder cancer.
Figures
Similar articles
-
Metformin Induced AMPK Activation, G0/G1 Phase Cell Cycle Arrest and the Inhibition of Growth of Esophageal Squamous Cell Carcinomas In Vitro and In Vivo.PLoS One. 2015 Jul 21;10(7):e0133349. doi: 10.1371/journal.pone.0133349. eCollection 2015. PLoS One. 2015. PMID: 26196392 Free PMC article.
-
Metformin induces G1 cell cycle arrest and inhibits cell proliferation in nasopharyngeal carcinoma cells.Anat Rec (Hoboken). 2011 Aug;294(8):1337-43. doi: 10.1002/ar.21283. Epub 2011 Jun 29. Anat Rec (Hoboken). 2011. PMID: 21717584
-
Metformin targets a YAP1-TEAD4 complex via AMPKα to regulate CCNE1/2 in bladder cancer cells.J Exp Clin Cancer Res. 2019 Aug 27;38(1):376. doi: 10.1186/s13046-019-1346-1. J Exp Clin Cancer Res. 2019. PMID: 31455378 Free PMC article.
-
Metformin in cancer therapy: a new perspective for an old antidiabetic drug?Mol Cancer Ther. 2010 May;9(5):1092-9. doi: 10.1158/1535-7163.MCT-09-1186. Epub 2010 May 4. Mol Cancer Ther. 2010. PMID: 20442309 Review.
-
Update on the Protective Renal Effects of Metformin in Diabetic Nephropathy.Curr Med Chem. 2017;24(31):3397-3412. doi: 10.2174/0929867324666170404143102. Curr Med Chem. 2017. PMID: 28393693 Review.
Cited by
-
Camel Milk Has Beneficial Effects on Diabetes Mellitus: A Systematic Review.Int J Endocrinol Metab. 2017 Mar 11;15(2):e42150. doi: 10.5812/ijem.42150. eCollection 2017 Apr. Int J Endocrinol Metab. 2017. PMID: 29026408 Free PMC article. Review.
-
Recent advances in bladder cancer stem cells (BCSCs): A descriptive review of emerging therapeutic targets.iScience. 2025 May 22;28(7):112720. doi: 10.1016/j.isci.2025.112720. eCollection 2025 Jul 18. iScience. 2025. PMID: 40635786 Free PMC article. Review.
-
Potential role for metformin in urologic oncology.Investig Clin Urol. 2016 May;57(3):157-64. doi: 10.4111/icu.2016.57.3.157. Epub 2016 May 10. Investig Clin Urol. 2016. PMID: 27195314 Free PMC article. Review.
-
Novel sequential therapy with metformin enhances the effects of cisplatin in testicular germ cell tumours via YAP1 signalling.Cancer Cell Int. 2022 Mar 9;22(1):113. doi: 10.1186/s12935-022-02534-w. Cancer Cell Int. 2022. PMID: 35264157 Free PMC article.
-
Metformin enhances the radiosensitizing effect of cisplatin in non-small cell lung cancer cell lines with different cisplatin sensitivities.Sci Rep. 2019 Feb 4;9(1):1282. doi: 10.1038/s41598-018-38004-5. Sci Rep. 2019. PMID: 30718758 Free PMC article.
References
-
- Siegel R., Ward E., Brawley O., Jemal A. Cancer statistics, 2011: The impact of eliminating socioeconomic and racial disparities on premature cancer deaths. CA Cancer J. Clin. 2011;61:212–236. - PubMed
-
- Bischoff C.J., Clark P.E. Bladder cancer. Curr. Opin. Oncol. 2009;21:272–277. - PubMed
-
- Herr H.W., Dotan Z., Donat S.M., Bajorin D.F. Defining optimal therapy for muscle invasive bladder cancer. J. Urol. 2007;177:437–443. - PubMed
-
- Choueiri T.K., Raghavan D. Chemotherapy for muscle-invasive bladder cancer treated with definitive radiotherapy: Persisting uncertainties. Nat. Clin. Pract. Oncol. 2008;5:444–454. - PubMed
Publication types
MeSH terms
Substances
LinkOut - more resources
Full Text Sources
Other Literature Sources
Medical
Research Materials
Miscellaneous
