. 2013:4:2984.
doi: 10.1038/ncomms3984.

Functional anatomy of an allosteric protein

Affiliations

Functional anatomy of an allosteric protein

Prasad Purohit et al. Nat Commun. 2013.

Abstract

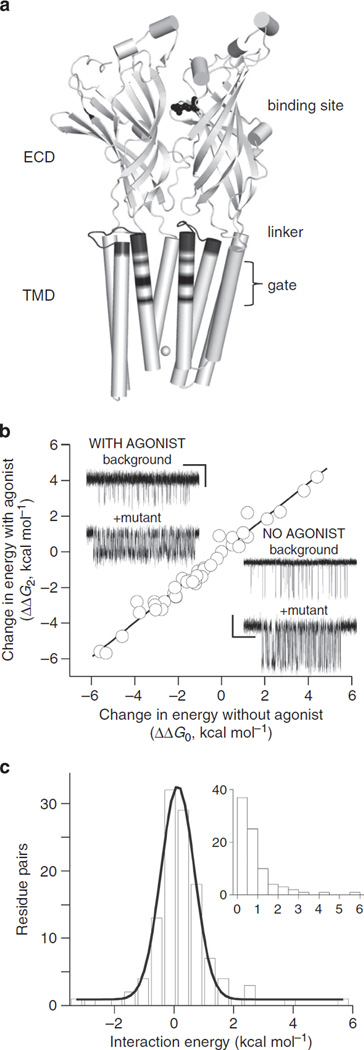
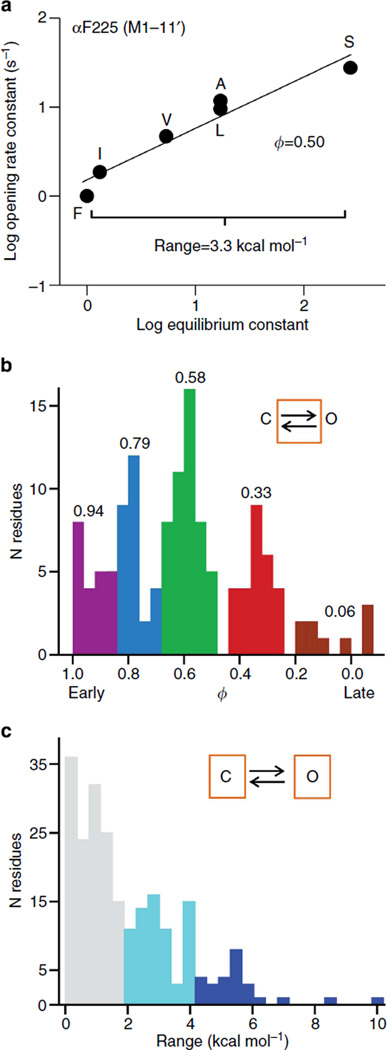
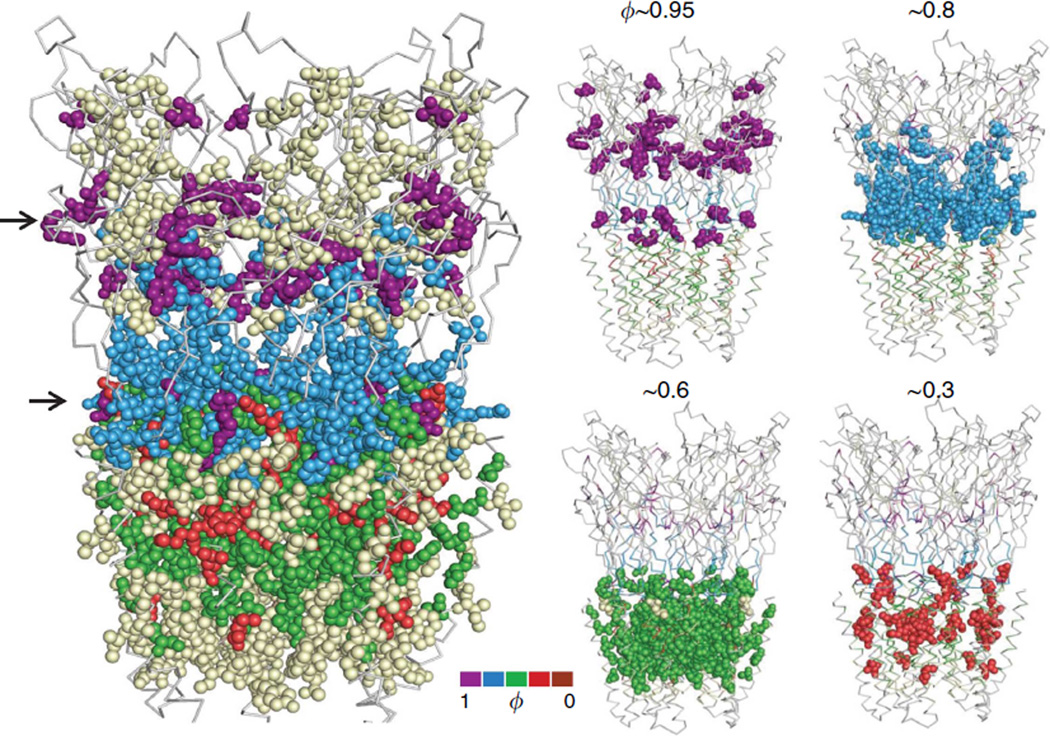
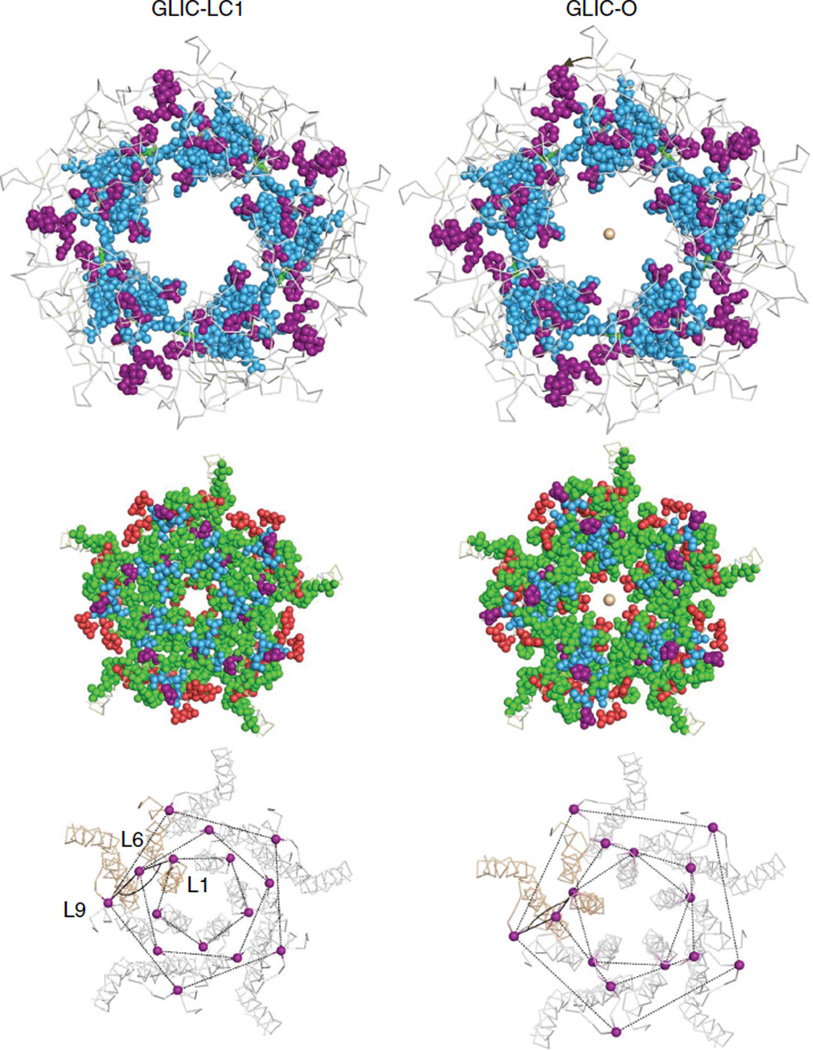
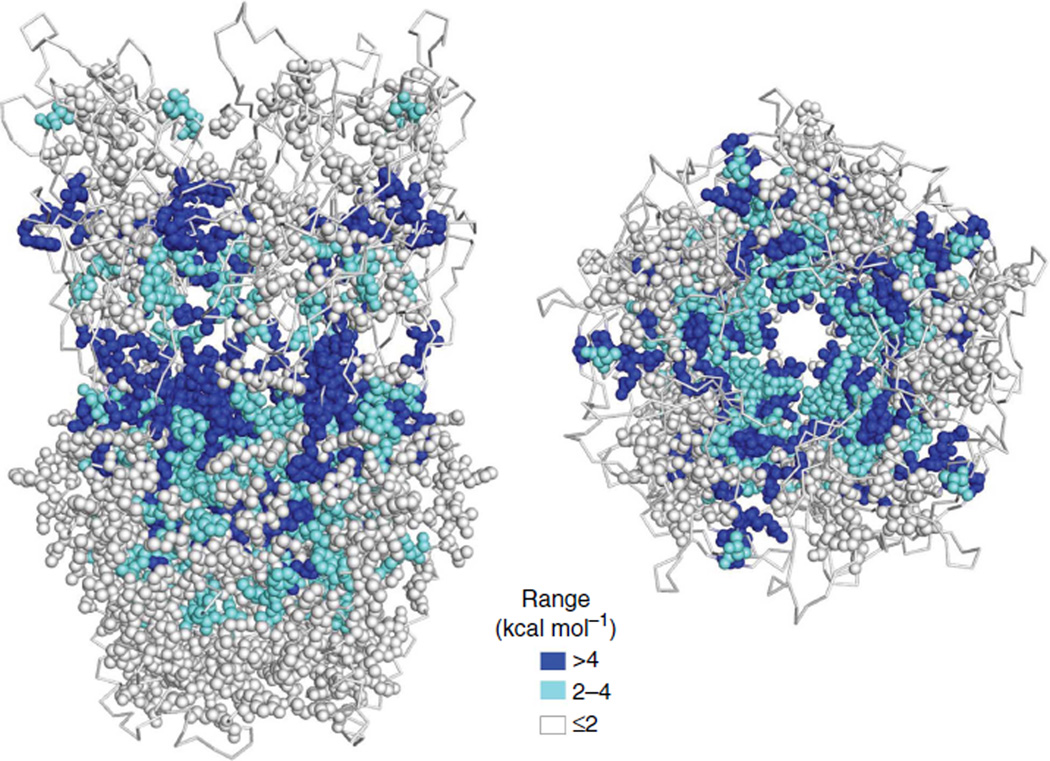
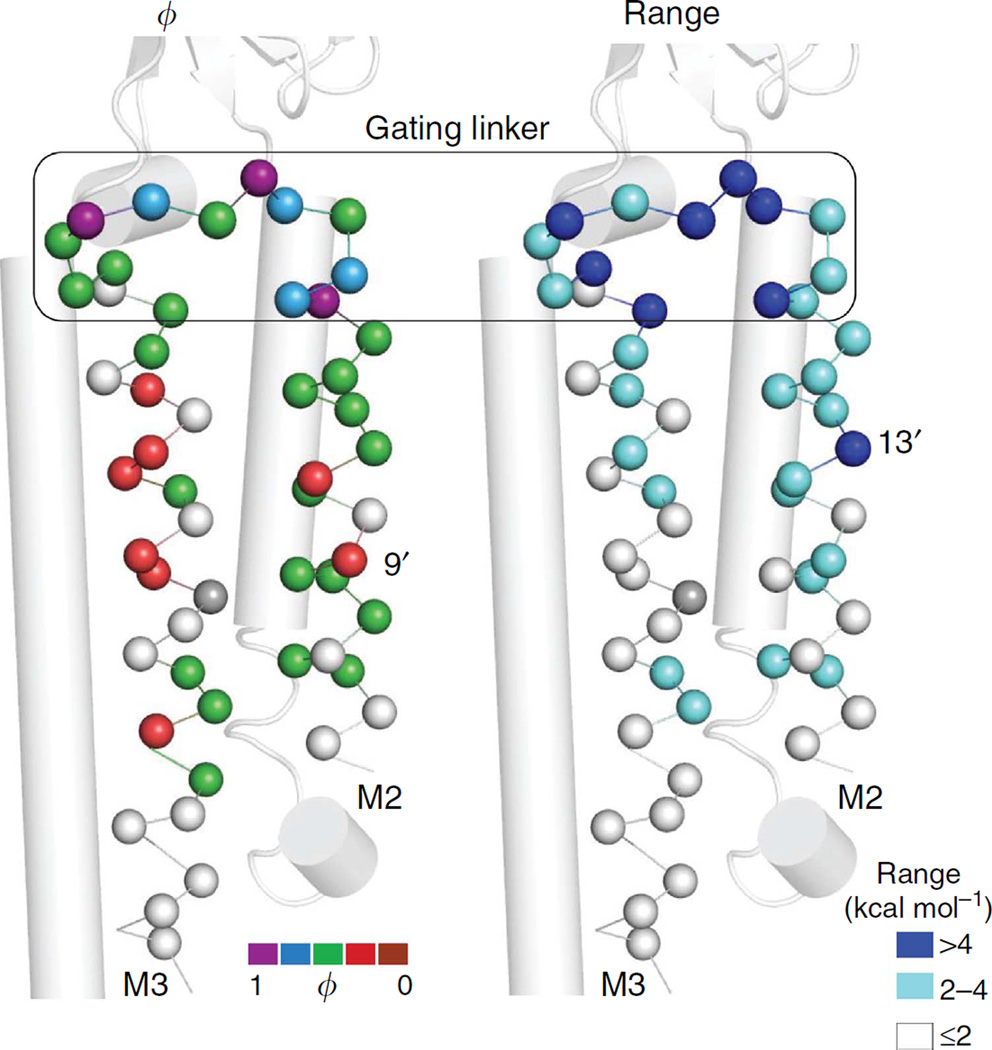
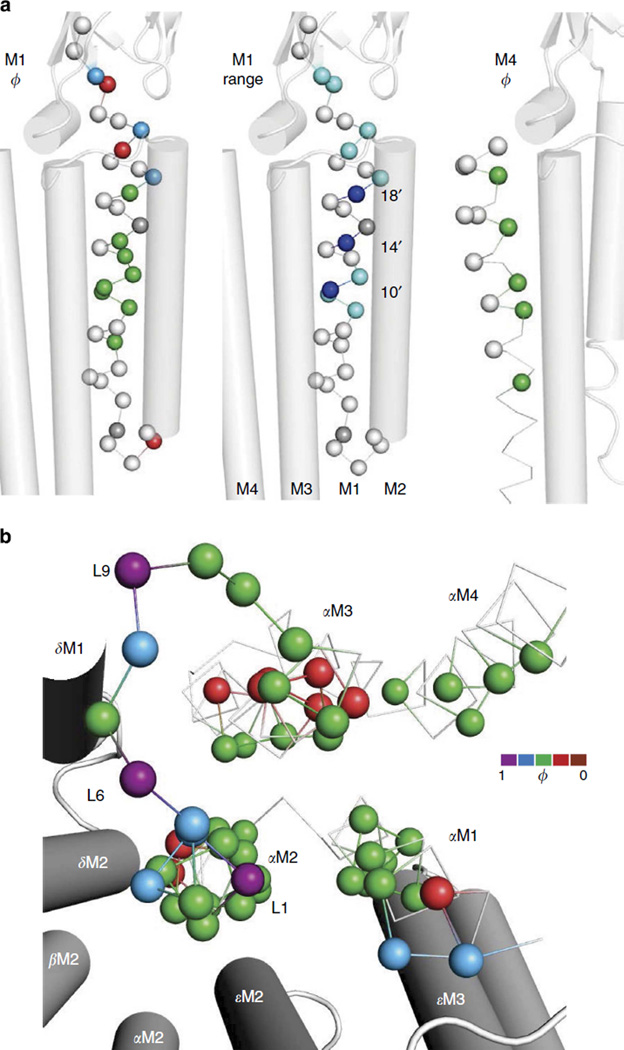
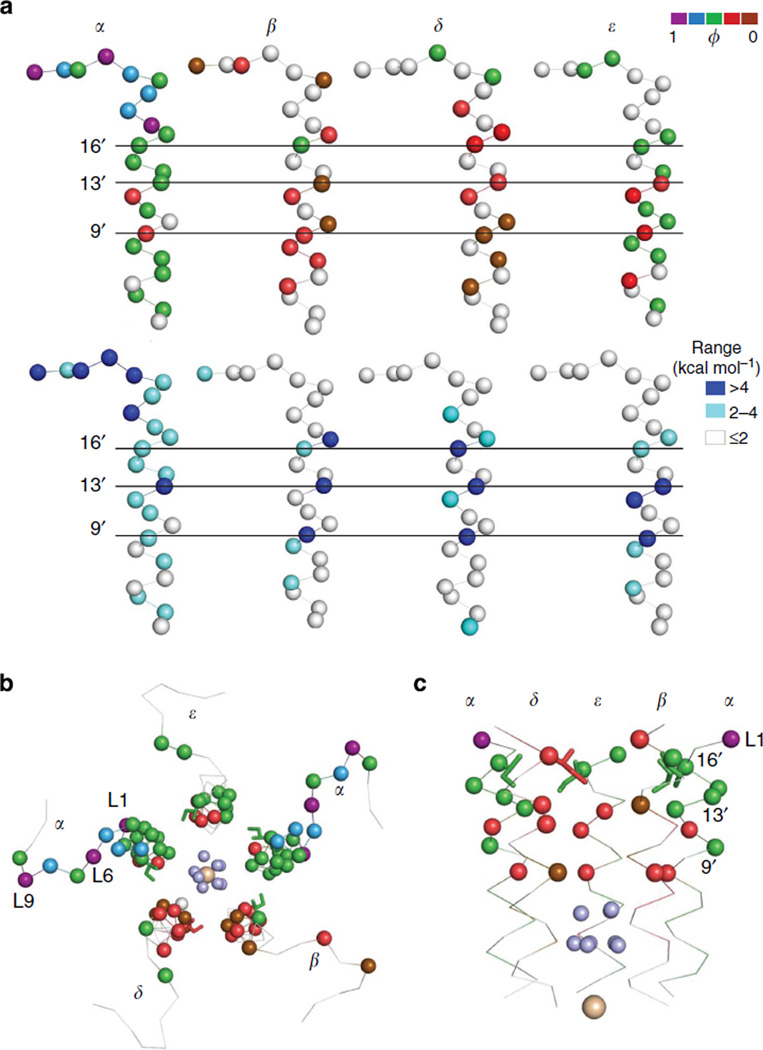
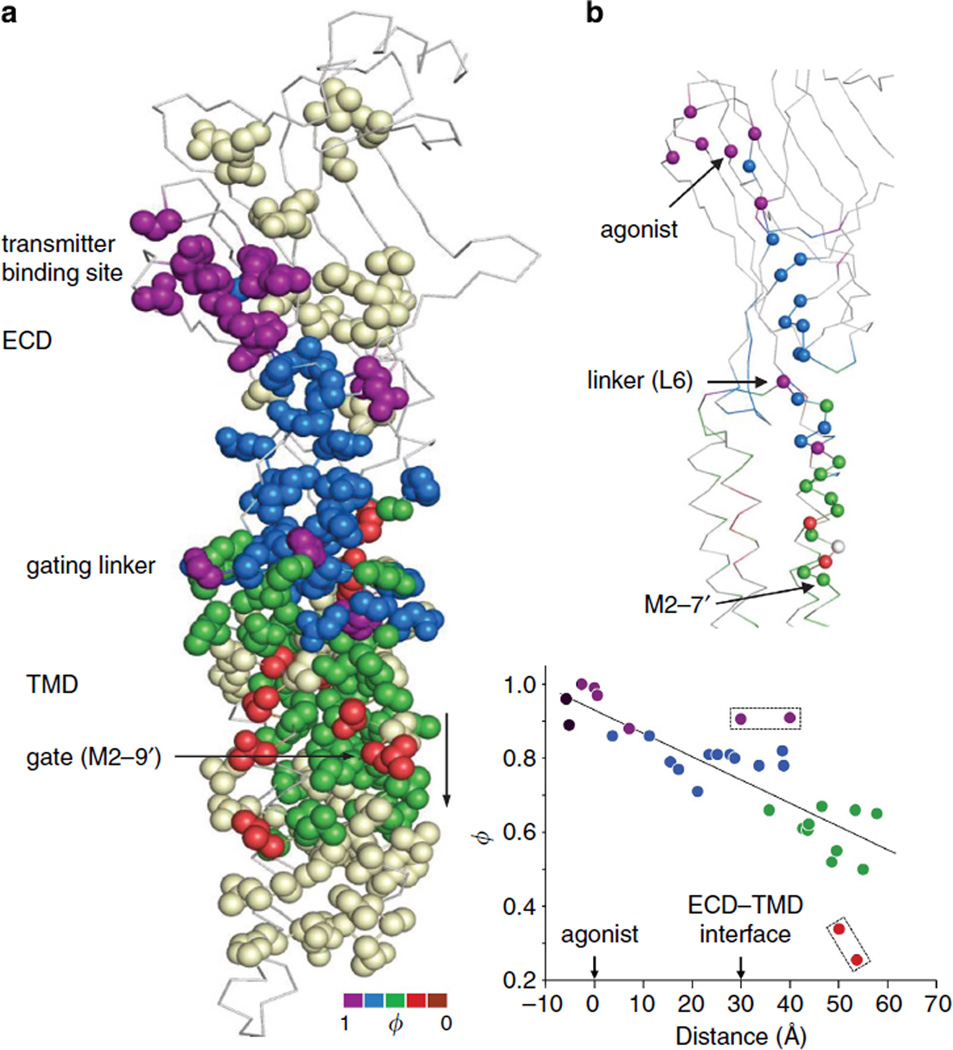
Synaptic receptors are allosteric proteins that switch on and off to regulate cell signalling. Here, we use single-channel electrophysiology to measure and map energy changes in the gating conformational change of a nicotinic acetylcholine receptor. Two separated regions in the α-subunits--the transmitter-binding sites and αM2-αM3 linkers in the membrane domain--have the highest ϕ-values (change conformation the earliest), followed by the extracellular domain, most of the membrane domain and the gate. Large gating-energy changes occur at the transmitter-binding sites, α-subunit interfaces, the αM1 helix and the gate. We hypothesize that rearrangements of the linkers trigger the global allosteric transition, and that the hydrophobic gate unlocks in three steps. The mostly local character of side-chain energy changes and the similarly high ϕ-values of separated domains, both with and without ligands, suggest that gating is not strictly a mechanical process initiated by the affinity change for the agonist.


Figures

Figure 1
Figure 1. Structure and function
(a) Cartoon showing two of the five GLIC subunits. The extracellular and transmembrane domains are labelled (ECD and TMD) along with three functionally important regions in AChRs (the transmitter-binding site, the gating linker and the M2 gate region). White sphere at bottom is Na +. (b) In AChRs, the effect of a mutation on the energy difference between the gating end states (C and O) is approximately the same with or without agonists at the transmitter-binding sites (see Supplementary Fig. S1). Each circle is a different mutation (Supplementary Table S1). Inset: single-channel currents showing the effect of one mutation (αN217T, in M1) relative to the background (Open is down; scale bar, 0.2 s, 2 pA with or 7 pA without agonist). Energies were estimated from the current interval durations. The diliganded current amplitude is smaller because of fast channel block by the agonist (choline), (c) Interaction energies from mutant cycle analyses (86 pairs),,–. The interaction energy is the difference between the energy change caused in the double mutant versus the sum of the effects for each mutation alone. On average, the interaction energy between separated residues is small but the width of the distribution suggests that there is some energy coupling over distance. Large interaction energies are from neighbors that share a common C versus O environment. Inset, absolute values of the interaction energies (median, 0.6).
Figure 2
Figure 2. Energy parameters (ϕ and range)
(a) An example R–E plot. Mutations were all of one amino acid (αF225; αM1-15′; see Fig. 7). Each symbol is the mean of ≥3 single-channel measurements for one mutation. ϕ is the linear slope and range is proportional to the log of the largest/ smallest equilibrium constant ratio. Additional R–E plots are shown in Supplementary Fig. S2. (b) Distribution of AChR gating ϕ-values (Supplementary Table S3). ϕ gives the relative position in the forward gating reaction when the residue changes its energy (structure) from C to O. There are five populations: 0.94 ±0.04 (n = 18), 0.79 ±0.04 (31), 0.58 ±0.05 (49), 0.33 ±0.05 (27) and 0.06 ±0.10 (9) (mean ± s.d.). (c) Distribution of range values. Range gives the relative C versus O energy change at the local residue environment.
Figure 3
Figure 3. AChR α-subunit ϕ values mapped onto the GLIC pentamer
Left, upper and lower arrows mark the level of the transmitter-binding sites and M2-M3 linkers in AChRs. The white ‘isoenergetic’ residues are located mainly above the binding sites and surrounding the TMD (Supplementary Table S3). Right, ϕ colour groups shown individually (see Fig. 2b). There are two, separated ϕ~0.95 (purple) clusters, at the binding sites and the M2-M3 linkers. The ϕ~0.8 (blue; ECD) and ϕ~0.6 (green; TMD) residues are tightly clustered, but the ϕ~0.3 residues in the TMD are more dispersed.
Figure 4
Figure 4. AChR α-subunit ϕ-values mapped onto non- and ion-conducting GLIC structures
Left, locally closed (LC1) and right, presumably Open (looking down the pore axis from the extracellular compartment). Top and middle, the ECD and TMD (isoenergetic residues not shown). Bottom, the three high-ϕ, purple amino acids in each M2-M3 linker have different configurations in LC1 versus O. Between LC1 and 0, the L1-L6-L9 angle changes from ~137° to ~109° (an anticlockwise rotation of L1 and L6 relative to L9) and L1 and L9 are displaced outward by ~25%. Similar comparisons between ELIC and GLIC are in Supplementary Fig. S4.
Figure 5
Figure 5. AChR α-subunit range values mapped onto the GLIC pentamer
Left, side view and right, top view. Large gating-energy changes are apparent at the binding sites, the ECD-TMD interface, along subunit interfaces, in M1 (see Fig. 7) and in the gate region (see Fig. 8).
Figure 6
Figure 6. Energy maps of αM2-αM3
Only αC atoms are shown (GluCl structure). The top turns of the M2 and M3 helices and the connecting amino acids have large ϕ- and range values (the ‘gating linker’; box). αM2-9′ (left, red) and -13′ (right, navy) are part of a hydrophobic girdle at the gate region (Figs 8c and 9). The lipid-facing, red residues in αM3 are at the ivermectin-binding site of GluCI (Supplementary Fig. S3).
Figure 7
Figure 7. Energy maps of αM1, αM4 and the αTMD
In all panels, the structure is GluCI. (a) αM1 and αM4. Left and centre, αM1. The 4′, 10′ and 18′ residues all have ϕ~0.6 and comprise a high-range stripe that faces the helix bundle core (grey, prolines for which a ϕ could not be measured). Right, ϕ-values for αM4. Residues that face the core have a ϕ~0.6 (green) and those that face the membrane are isoenergetic (white), (b) ϕ map of the αTMD (top view). In all α-subunit TMD helices, most residues that project into the core are green, as are most in all of M2. A cluster of ϕ~0.3 (red) residues in αM3 faces the lipid (see Supplementary Fig. S3). The five ϕ~0.8 (blue) residues are all close to the ECD-TMD interface. There are three ϕ~0.95 (purple) residues in the gating linker (L1, L6 and L9). The isoenergetic residues are not shown.
Figure 8
Figure 8. Energy maps of M2
In all panels, the structure is GLIC (Open), (a) ϕ (top) and range (bottom) by subunit (2′-26′). The 9′, 13′ and 16′ residues experience large C versus O energy differences (navy). M2 is mostly ϕ~0.6 in α and ε, but mostly ≤0.3 in β and δ. The 9′, 13′ and 16′ amino acids are mostly of large range, in all subunits. (b) Top view of the gating linker and M2 showing ϕ-values for all AChR subunits (isoenergetic positions not shown). Tan sphere is Na+ and light blue spheres are waters. The large ϕ and range of the gating linker only pertains to the two α-subunits. (c) Side view of the gate region. For clarity, only αC atoms of residues with a range ≥3 kcal mol−1 are shown. There is a cluster of low-ϕ, high-range residues (9′-16′) above the waters.
Figure 9
Figure 9. Close views of ϕ-values in the M2 gate region
Colour is according to ϕ-value (Supplementary Table S3). Left, side view of M2 9′–16′ (extracellular is up). In LC1, the side chains at 16′, 13′ and 9′ form a layered barrier to ion permeation (a gate) that is expanded in O, by energy changes from the green, red and brown ϕ groups. The largest ranges in this gate region are at 13′ in all subunits (Fig. 8), perhaps because these side chains are positioned in the middle of the sandwich. Right, top view of the 9′–13′ hydrophobic girdle. α13′ has the highest ϕ (0.52, green), and β13′ and 89′ have the lowest ϕ-values (0.12, brown). For the other 9′–12′–13 positions, ϕ = 0.32 ± 0.06 (mean ± s.d.; n = 9). A similar comparison using ELIC is shown in Supplementary Fig. S4.
Figure 10
Figure 10. AChR α-subunit ϕ-values mapped onto a GluCI subunit
(a) Vertical arrow marks the pore. The isoenergetic residues are above the binding sites, below the gate region and facing the membrane (b) Top, ϕ-values along a pathway that connects the binding site with the gate via loop 2. Bottom, along this structure, ϕ decreases approximately linearly at a rate of 0.063 ± 0.006 nm−1 Boxed, L6 and L1 in the gating linker (purple) and M2-12′ and 9′ in the gate region (red); when these four are included in the linear fit, slope = − 0.072 ± 0.01 nm−1.

References

    1. Corringer P-J, et al. Structure and pharmacology of pentameric receptor channels: from bacteria to brain. Structure. 2012;20:941–956. - PubMed
    1. Hibbs RE, Gouaux E. Principles of activation and permeation in an anion-selective Cys-loop receptor. Nature. 2011;474:54–60. - PMC - PubMed
    1. Sauguet L, et al. Structural basis for ion permeation mechanism in pentameric ligand-gated ion channels. EMBO J. 2013;32:728–741. - PMC - PubMed
    1. Pan J, et al. Structure of the pentameric ligand-gated ion channel ELIC cocrystallized with its competitive antagonist acetylcholine. Nat. Commun. 2012;3:714. - PMC - PubMed
    1. Bocquet N, et al. X-ray structure of a pentameric ligand-gated ion channel in an apparently open conformation. Nature. 2009;457:111–114. - PubMed

Publication types

LinkOut - more resources