

Inferring the choreography of parental genomes during fertilization from ultralarge-scale whole-transcriptome analysis
- PMID: 24352427
- PMCID: PMC3877761
- DOI: 10.1101/gad.227926.113
Inferring the choreography of parental genomes during fertilization from ultralarge-scale whole-transcriptome analysis
Abstract
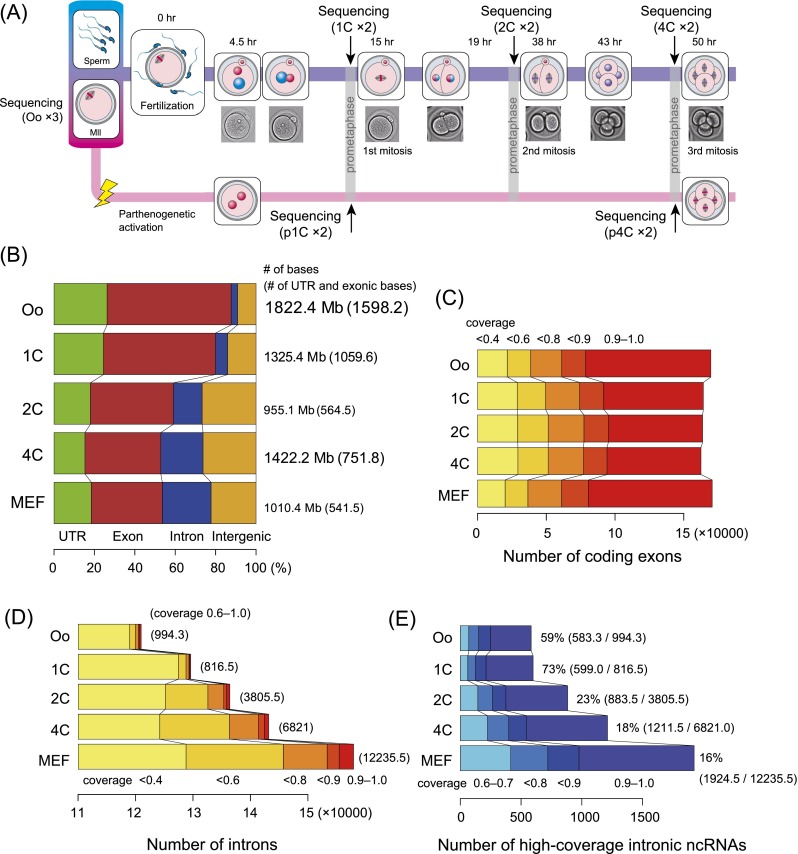
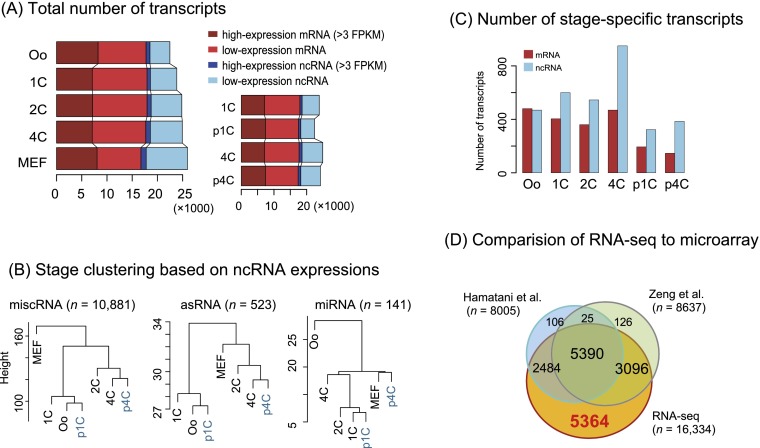
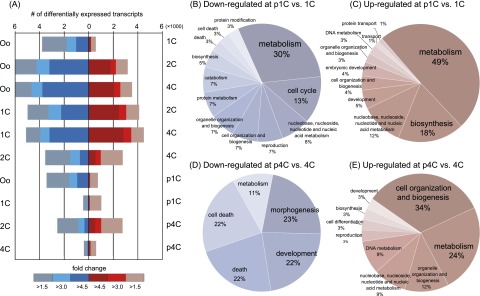
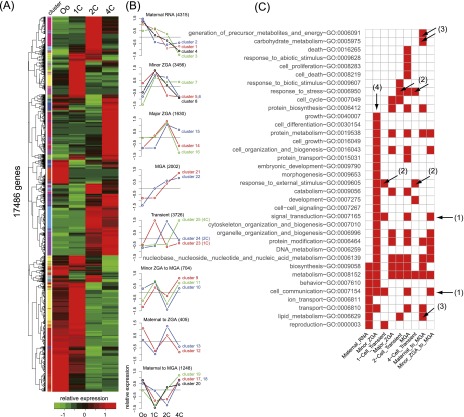
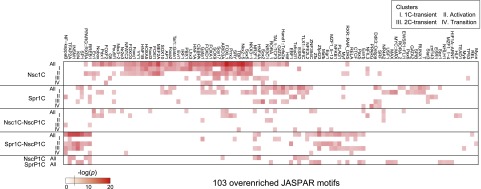
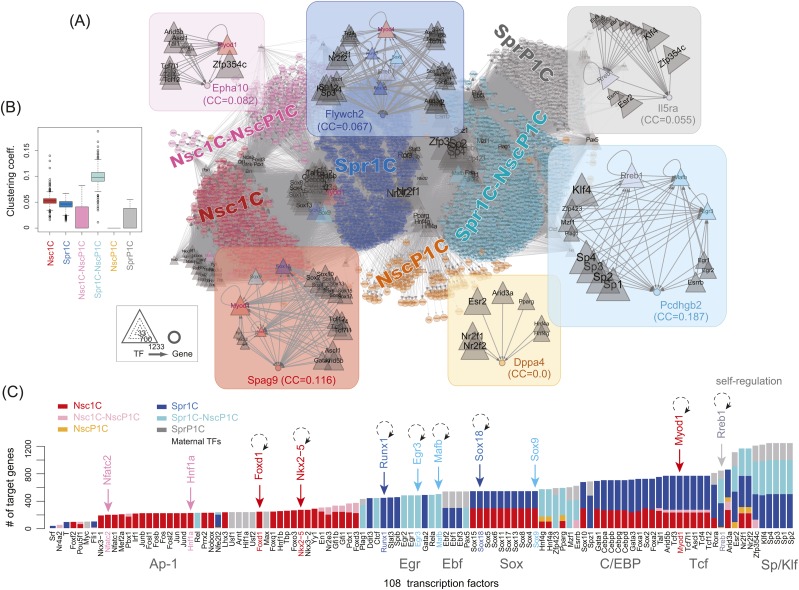
Fertilization precisely choreographs parental genomes by using gamete-derived cellular factors and activating genome regulatory programs. However, the mechanism remains elusive owing to the technical difficulties of preparing large numbers of high-quality preimplantation cells. Here, we collected >14 × 10(4) high-quality mouse metaphase II oocytes and used these to establish detailed transcriptional profiles for four early embryo stages and parthenogenetic development. By combining these profiles with other public resources, we found evidence that gene silencing appeared to be mediated in part by noncoding RNAs and that this was a prerequisite for post-fertilization development. Notably, we identified 817 genes that were differentially expressed in embryos after fertilization compared with parthenotes. The regulation of these genes was distinctly different from those expressed in parthenotes, suggesting functional specialization of particular transcription factors prior to first cell cleavage. We identified five transcription factors that were potentially necessary for developmental progression: Foxd1, Nkx2-5, Sox18, Myod1, and Runx1. Our very large-scale whole-transcriptome profile of early mouse embryos yielded a novel and valuable resource for studies in developmental biology and stem cell research. The database is available at http://dbtmee.hgc.jp.
Keywords: development; fertilization; parthenogenesis; transcription factor; transcriptome.
Figures
References
-
- Amanai M, Brahmajosyula M, Perry AC 2006. A restricted role for sperm-borne microRNAs in mammalian fertilization. Biol Reprod 75: 877–884 - PubMed
-
- Beaujean N, Bouniol-Baly C, Monod C, Kissa K, Jullien D, Aulner N, Amirand C, Debey P, Kas E 2000. Induction of early transcription in one-cell mouse embryos by microinjection of the nonhistone chromosomal protein HMG-I. Dev Biol 221: 337–354 - PubMed
-
- Bui HT, Wakayama S, Mizutani E, Park KK, Kim JH, Van Thuan N, Wakayama T 2011. Essential role of paternal chromatin in the regulation of transcriptional activity during mouse preimplantation development. Reproduction 141: 67–77 - PubMed
-
- Casanova EA, Shakhova O, Patel SS, Asner IN, Pelczar P, Weber FA, Graf U, Sommer L, Burki K, Cinelli P, et al. 2011. Pramel7 mediates LIF/STAT3-dependent self-renewal in embryonic stem cells. Stem Cells 29: 474–485 - PubMed
Publication types
MeSH terms
Substances
Associated data
LinkOut - more resources
Full Text Sources
Other Literature Sources