. 2014 Mar;88(5):2584-99.
doi: 10.1128/JVI.02575-13. Epub 2013 Dec 18.

Large-scale production and structural and biophysical characterizations of the human hepatitis B virus polymerase

Affiliations

Large-scale production and structural and biophysical characterizations of the human hepatitis B virus polymerase

Judit Vörös et al. J Virol. 2014 Mar.

Abstract

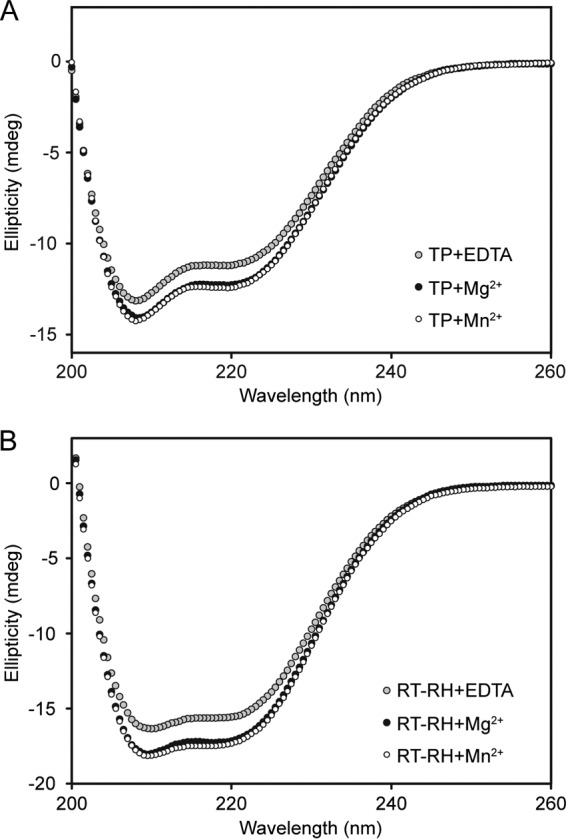
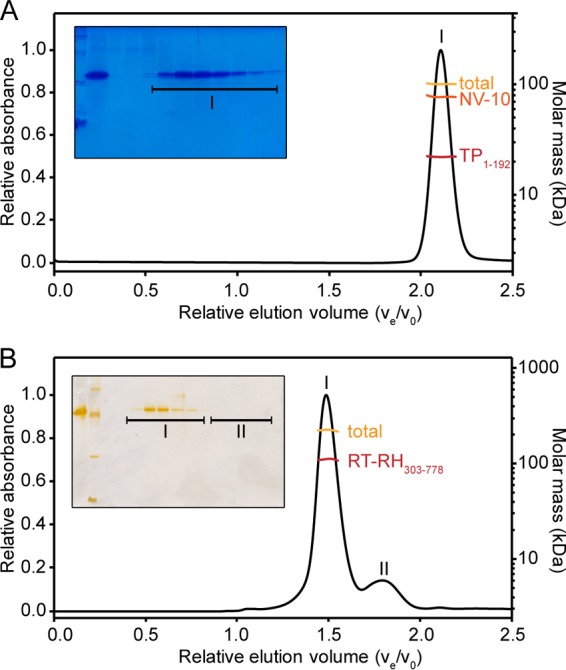
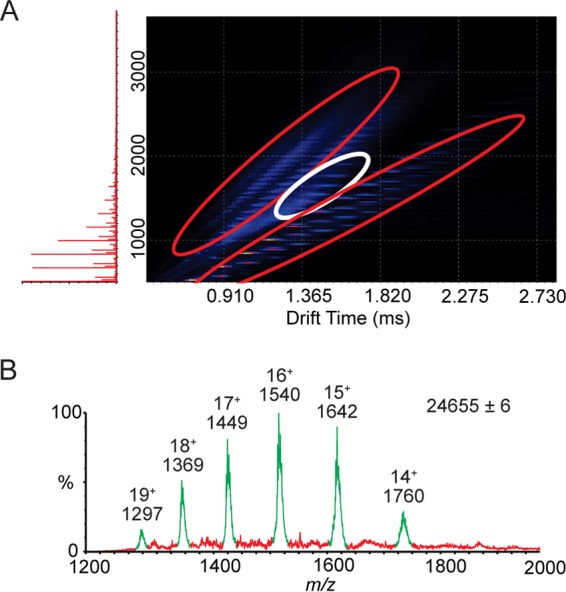
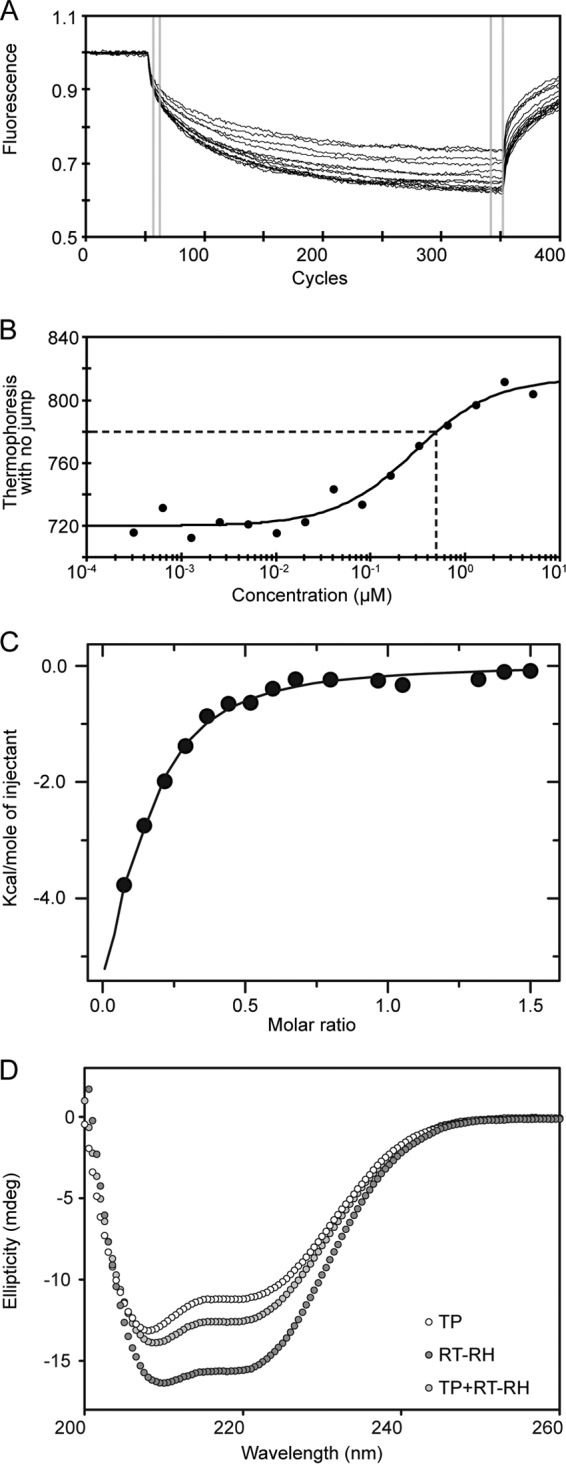
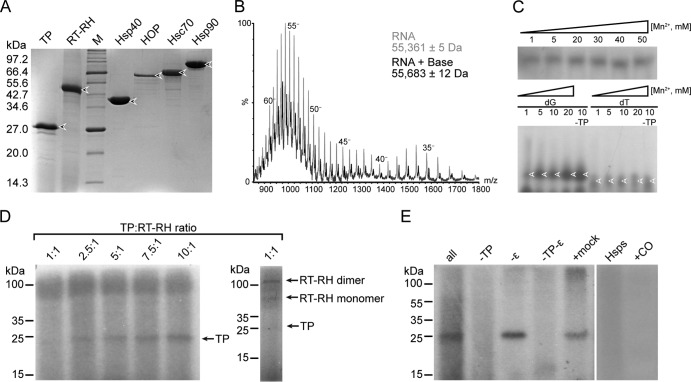
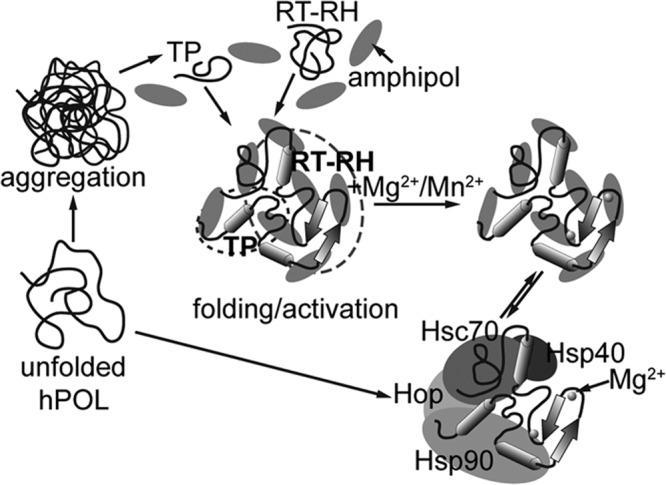
Hepatitis B virus (HBV) is a major human pathogen that causes serious liver disease and 600,000 deaths annually. Approved therapies for treating chronic HBV infections usually target the multifunctional viral polymerase (hPOL). Unfortunately, these therapies--broad-spectrum antivirals--are not general cures, have side effects, and cause viral resistance. While hPOL remains an attractive therapeutic target, it is notoriously difficult to express and purify in a soluble form at yields appropriate for structural studies. Thus, no empirical structural data exist for hPOL, and this impedes medicinal chemistry and rational lead discovery efforts targeting HBV. Here, we present an efficient strategy to overexpress recombinant hPOL domains in Escherichia coli, purifying them at high yield and solving their known aggregation tendencies. This allowed us to perform the first structural and biophysical characterizations of hPOL domains. Apo-hPOL domains adopt mainly α-helical structures with small amounts of β-sheet structures. Our recombinant material exhibited metal-dependent, reverse transcriptase activity in vitro, with metal binding modulating the hPOL structure. Calcomine orange 2RS, a small molecule that inhibits duck HBV POL activity, also inhibited the in vitro priming activity of recombinant hPOL. Our work paves the way for structural and biophysical characterizations of hPOL and should facilitate high-throughput lead discovery for HBV.

Importance: The viral polymerase from human hepatitis B virus (hPOL) is a well-validated therapeutic target. However, recombinant hPOL has a well-deserved reputation for being extremely difficult to express in a soluble, active form in yields appropriate to the structural studies that usually play an important role in drug discovery programs. This has hindered the development of much-needed new antivirals for HBV. However, we have solved this problem and report here procedures for expressing recombinant hPOL domains in Escherichia coli and also methods for purifying them in soluble forms that have activity in vitro. We also present the first structural and biophysical characterizations of hPOL. Our work paves the way for new insights into hPOL structure and function, which should assist the discovery of novel antivirals for HBV.


Figures

FIG 1
FIG 1
Schematic representation of protein-primed initiation of reverse transcription mediated by hPOL. The epsilon stem-loop found on HBV pregenomic RNA is represented by a solid black line (internal base pairing is shown as short cross-hatches). The hPOL TP, spacer, RT, and RH domains are shaded. During protein-primed initiation of reverse transcription, the enzymatic activity of RT covalently attaches a deoxyribonucleotide to the side chain hydroxyl group of Y63 in TP (8, 13). This priming reaction is guided by the epsilon template. The first nucleotide incorporated into TP has been reported to be G (as shown here), whereas others have shown that T can also be used (shown in lowercase) (17, 31, 46, 87).
FIG 2
FIG 2
Reappraisal of the boundaries of hPOL structural domains. (A) Annotation of secondary structure predictions based on HCA (gray symbols above the schematic presentation of classical hPOL domain boundaries) and using sequence-based algorithms (gray symbols below the schematic presentation of classical hPOL domains) (57, 58). The boundaries of classical domains are numbered. Predicted α-helical (gray cylinders) and β-strand (gray arrows) secondary structures are shown. Ambiguous, but predicted to be structured, regions are indicated by question marks. Disagreements between the HCA and the consensus of conventional algorithms are indicated by boxed areas on the conventional sequence-based algorithms. Red arrows indicate the newly identified putative domain boundaries of TP, whereas the cyan arrows indicate the new domain boundaries for RT-RH. (B) Optimizing hPOL domain boundaries for expression in E. coli. (Upper graphic) Classical hPOL domain boundaries as reported in the literature (10, 34). Functionally important residues in the TP and RT domains are indicated. (Lower graphic) Black bars indicate the TP and concatemeric RT-RH constructs we designed, with optimized domain boundaries based upon hydrophobic cluster analyses (58), secondary structure prediction algorithms (57), and removal of motifs that could cause aggregation or proteolysis.
FIG 3
FIG 3
Coomassie blue-stained SDS-PAGE gels of recombinant TP1–192 and RT-RH constructs expressed in E. coli. (A) Lane 1, noninduced C41(DE3) cells containing pET21a_TP192, which contains a TP1–192 insert with a C-terminal six-histidine tag (see Materials and Methods); lane 2, overnight expression of pET21a_TP1–192 in C41(DE3) cells. The arrow indicates TP1–192. Lane M, protein size markers. (B) Expression of RT-RH constructs in BL21(DE3) cells. RT-RH285–832 (lanes 1, 4, and 7), RT-RH303–778 (lanes 2, 5, and 8), and RT-RH303–783 (lanes 3, 6, and 9) results are shown, where these constructs had an N-terminal six-His-tagged MBP fusion partner (6His-MBP-X), an N-terminal MBP fusion partner, and a C-terminal six-His tag (MBP-X-6His) or a C-terminal 6-His tag (X-6His), as indicated above the gel. Arrows indicate expression of different RT-RH constructs. Notably, RT-RH constructs had a higher mobility than expected from their theoretical mass, even though they were confirmed to be full length based on proteomic analyses (unpublished data). (C) BL21(DE3) cells transformed with 6His-MBP-RT-RH303–778 were grown at 30°C (left panel) and at 42°C (right panel, to stimulate chaperone expression) prior to expression at 30°C. Postinduction, samples were taken at the times (in min) indicated at the bottom of these gels. Total material (T) and soluble fractions (S) of cell lysates were analyzed using SDS-PAGE. Arrows indicate expected products; lane M contains protein size markers. These data are representative of the heat shock-induced enhancement of protein expression observed for all RT-RH303–778 and RT-RH303–783 constructs.
FIG 4
FIG 4
Purification of recombinant TP1–192 and RT-RH303–778. (A) Silver-stained SDS-PAGE gels from the purification procedure for TP1–192. Purified inclusion bodies (lane 1) were solubilized in 6 M guanidine-HCl and loaded onto a metal affinity column. The resultant flowthrough (lane 2), wash (lane 3), nonspecific wash (lane 4), and elution fractions (lanes 5 and 6) are shown. The arrow indicates pure protein used for in vitro refolding. The masses (in kDa) of molecular size markers (lane M) are indicated on the left. (B) Coomassie blue-stained SDS-PAGE gel showing purification of recombinant RT-RH303–778. Lane 1, purified inclusion bodies containing RT-RH303–778; lane 2, flowthrough from Ni-affinity column; lane 3, wash of Ni-affinity column; lane M, protein marker; lanes 4 to 8, elution fractions from Ni-affinity column; lane 9, pool of purified and refolded RT-RH303–778.
FIG 5
FIG 5
Far-UV CD spectroscopy of recombinant TP1–192 and RT-RH303–778. (A) The far-UV CD spectrum of apo-TP1–192 was consistent with it being largely α-helical and having smaller amounts of β-sheet and coil-like structures (Table 1). Magnesium chloride and manganese chloride induced very similar increases in the secondary structure of TP1–192. (B) The far-UV CD spectrum of apo-RT-RH303–778 was consistent with it being mainly α-helical but having a smaller amount of β-sheet structure (as per sequence-based structure predictions [Table 1]). Magnesium chloride and manganese chloride induced identical increases in the secondary structure of RT-RH303–778. All spectra were acquired at 20°C using a 0.15-mg/ml protein solution (equivalent to ∼6 μM TP1–192 and ∼2.7 μM RT-RH303–778) with divalent metal ions at a final concentration of 2.5 mM (described in Materials and Methods).
FIG 6
FIG 6
SEC-MALS analysis of recombinant TP1–192 and RT-RH303–778. (A) A 10-μl aliquot of a 300 μM sample of TP1–192 was injected onto a 24-ml analytical Superose 6 column. The UV absorbance at 280 nm was plotted against relative elution volume (Ve/V0). The TP1–192 preparation contained only a single elution peak, corresponding to TP1–192 extensively decorated with NV-10 molecules. Conjugate analysis (see Materials and Methods) showed that the total mass of this complex was ∼100 kDa (gold line), but the complex contained only TP1–192 monomers (∼ 25 kDa; red line) bound to many NV-10 molecules (orange line). (Inset) SDS-PAGE showed that the elution peak contained pure TP1–192. (B) A 10-μl aliquot of a 165 μM sample of RT-RH303–778 was injected onto a 24-ml analytical Superdex 200 column. UV absorbance at 280 nm was plotted against relative elution volume. Only two major elution peaks were observed for recombinant RT-RH303–778 (peaks I and II). Peak I contained a complex with a molar mass of ∼221 kDa (gold line), which contained only dimeric RT-RH303–778 (red line). For clarity, the molar mass of the NV-10 component was omitted here, as it would obscure the results for RT-RH303–778. (Inset) Only peak I contained protein. Peak II contained NV-10 oligomers.
FIG 7
FIG 7
Ion mobility spectrometry-mass spectrometry analysis of TP1–192. (A) Three-dimensional IMS-MS DriftScope plot of 20 μM TP1–192 in 100 mM ammonium acetate buffer (pH 5.5; containing NV-10 at an ∼20-fold molar excess over TP1–192). The mass-to-charge ratio (m/z) is shown on the y axis, and the drift time (corresponding to the transit time through the IMS drift cell) is shown on the x axis. The relative ion intensity is shown by the colors: yellow and black represent the most and least intense ions, respectively. The mass spectrum comprises mainly intense signals arising from the amphipol (circled in red). Careful examination of the DriftScope plot, however, shows a band of signals arising from TP1–192 that have the bow shape characteristic of a protein charge-state distribution (circled in white). Very similar IMS-MS data were obtained using 100 mM ammonium bicarbonate buffer (pH 7.8). (B) The signals giving rise to the TP1–192 charge-state distribution (shown in panel A) were extracted by using DriftScope (the manufacturer's software; Waters UK Ltd.) and plotted as a separate mass spectrum. The TP1–192 charge-state distribution encompassed the 14+ through 19+ ions and was consistent with a polypeptide with a mass of 24,655 Da (which agreed well with the theoretical monomer mass of 24,645 Da). These data show that TP1–192 is monomeric and forms a complex with NV-10 molecules.
FIG 8
FIG 8
Binding studies of TP1–192 and RT-RH303–778. (A) Normalized fluorescence data for the raw MST signal acquired for each titration point. Initial fluorescence was recorded for 5 s before the establishment of a temperature gradient (of ∼6°C) for 30 s. The differences in normalized fluorescence intensities in the selected data range (gray bars) were used to determine the binding curve shown in panel B (76). (B) MST binding curve acquired by titrating nonlabeled RT-RH303–778 into labeled TP1–192. A 1:2 dilution series was applied, with the highest RT-RH303–778 concentration being 5.2 μM, whereas the concentration of labeled TP1–192 was kept at 40 nM. The fitted MST data yielded apparent Kd values in the range of 0.5 to 3 μM (dashed lines indicate the Kd from the titration). (C) ITC binding curve for the interaction between TP1–192 and RT-RH303–778 at 20°C. A stock of ∼100 μM TP1–192 was titrated against a stock of ∼20 μM RT-RH303–778 in the calorimeter cell. The apparent Kd of this interaction (∼5 μM) agreed well with that determined using MST (panel B). (D) Far-UV CD spectra of recombinant TP1–192 (white circles, ∼0.075 mg/ml), RT-RH303–778 (dark grey circles, ∼0.075 mg/ml), and a 2:1 molar ratio of TP1–192 and RT-RH303–778 (light grey circles, ∼0.15 mg/ml total protein concentration).
FIG 9
FIG 9
In vitro protein-priming activity of recombinant TP1–192 and RT-RH303–778. (A) SDS-PAGE analysis of hPOL constructs and chaperones used in functional assays. Protein identities and the molecular mass (in kDa) of size markers (lane M) are indicated. (B) ESI-MS result for a 40 μM solution of epsilon RNA in a 50 mM piperidine-imidazole solution. This (denatured) mass spectrum showed that the predominant RNA ions had a molecular mass of 55,361 Da, consistent with being an epsilon 172-mer rather than the expected 174-mer (theoretical mass of 56,235 Da). Less-prominent ions were also observed, with an additional mass of 322 Da, consistent with an epsilon 173-mer also being present. (C, upper gel) Results of in vitro priming using [α-32P]dTTP in the presence of increasing manganese chloride concentrations and a fixed magnesium chloride concentration of 6 mM (thus, the Mn/Mg ratio varied from 1:6 to 8.3:1). SDS-PAGE and autoradiography showed incorporation of radiolabeled dTMP, consistent with protein priming, into a protein with a mass of ∼100 kDa. (Lower gel) Results of in vitro priming followed by urea-PAGE and autoradiography. The effects of adding [α-32P]dGTP versus [α-32P]dTTP and increasing manganese concentrations were compared, with the magnesium concentration held at 5 mM (thus, the Mn/Mg ratio varied from 1:5 through 4:1). Arrows indicate labeled proteins. Removing TP did not reduce protein labeling, consistent with cryptic priming by RT (42, 43). (D) In vitro priming in the presence of [α-32P]dGTP and with molar ratios of TP1–192:RT-RH303–778 that ranged from 1:1 to 10:1. SDS-PAGE and autoradiography showed incorporation of radiolabeled dGMP into three species: TP1–192 (mass of ∼25 kDa), as well as monomeric and dimeric RT-RH303–778 (molecular masses of ∼55 and ∼100 kDa, respectively). The signal intensity for the authentic priming reaction (i.e., labeling of TP1–192) was significantly increased at higher molar ratios of TP1–192:RT-RH303–778. This is consistent with authentic priming outcompeting the cryptic priming when TP1–192 is present in molar excess. Protein identities and molecular mass markers are indicated. (E) Specificity of in vitro priming reactions. [α-32P]dGTP was used as the radioactive substrate, with products resolved using SDS-PAGE and labeled species detected using autoradiography. Shown is a comparison of a full reaction mixture (all) versus control reaction mixtures that lacked TP, lacked epsilon, lacked TP and epsilon, or included a similar-sized, unrelated RNA instead of epsilon (mock). These data show that the product of the authentic priming reaction was strictly TP dependent but was not strictly epsilon dependent (46). No priming product was observed for the reaction mixture containing only recombinant human chaperones and the ATP regeneration systems (Hsps), demonstrating that the labeling reaction was dependent on the presence of hPOL activities. Similarly, priming activity was ablated when we used Calcomine orange RS (+CO), a known inhibitor of hPOL activity (79). The molecular masses are indicated.
FIG 10
FIG 10
Schematic of in vitro reconstitution of functional hPOL complexes. Unfolded hPOL has an extreme tendency to aggregate and form inclusion bodies. This aggregation can be attenuated in the presence of host chaperones that bind to and presumably stabilize hPOL in a conformation that can then be activated (lower pathway). The strategy we employed here entailed expression of independent TP1–192 and RT-RH303–778 constructs and NV-10 (shaded ellipses) to ameliorate aggregation (upper pathway). hPOL domains thus treated were structured, could interact with each other, bound metals, and had in vitro activities in the presence of recombinant host chaperones (middle pathway). It is possible that amphipols and host chaperones have the same or overlapping binding motifs. The secondary structure and their partitioning into TP and RT-RH domains shown here are purely schematic.

Similar articles

Cited by

References

    1. Ott JJ, Stevens GA, Groeger J, Wiersma ST. 2012. Global epidemiology of hepatitis B virus infection: new estimates of age-specific HBsAg seroprevalence and endemicity. Vaccine 30:2212–2219. 10.1016/j.vaccine.2011.12.116 - DOI - PubMed
    1. Michailidis E, Kirby KA, Hachiya A, Yoo W, Hong SP, Kim S-O, Folk WR, Sarafianos SG. 2012. Antiviral therapies: focus on hepatitis B reverse transcriptase. Int. J. Biochem. Cell Biol. 44:1060–1071. 10.1016/j.biocel.2012.04.006 - DOI - PMC - PubMed
    1. Zoulim F. 2011. Hepatitis B virus resistance to antiviral drugs: where are we going? Liver Int. 31(Suppl 1):111–116. 10.1111/j.1478-3231.2010.02399.x - DOI - PMC - PubMed
    1. Bhattacharya D, Thio CL. 2010. Review of hepatitis B therapeutics. Clin. Infect. Dis. 51:1201–1208. 10.1086/656624 - DOI - PMC - PubMed
    1. Matthews SJ. 2006. Entecavir for the treatment of chronic hepatitis B virus infection. Clin. Ther. 28:184–203. 10.1016/j.clinthera.2006.02.012 - DOI - PubMed

Publication types

MeSH terms