. 2014 Mar;88(5):2489-507.
doi: 10.1128/JVI.02853-13. Epub 2013 Dec 18.

Global panel of HIV-1 Env reference strains for standardized assessments of vaccine-elicited neutralizing antibodies

Affiliations

Global panel of HIV-1 Env reference strains for standardized assessments of vaccine-elicited neutralizing antibodies

Allan deCamp et al. J Virol. 2014 Mar.

Abstract

Standardized assessments of HIV-1 vaccine-elicited neutralizing antibody responses are complicated by the genetic and antigenic variability of the viral envelope glycoproteins (Envs). To address these issues, suitable reference strains are needed that are representative of the global epidemic. Several panels have been recommended previously, but no clear answers have been available on how many and which strains are best suited for this purpose. We used a statistical model selection method to identify a global panel of reference Env clones from among 219 Env-pseudotyped viruses assayed in TZM-bl cells with sera from 205 HIV-1-infected individuals. The Envs and sera were sampled globally from diverse geographic locations and represented all major genetic subtypes and circulating recombinant forms of the virus. Assays with a panel size of only nine viruses adequately represented the spectrum of HIV-1 serum neutralizing activity seen with the larger panel of 219 viruses. An optimal panel of nine viruses was selected and augmented with three additional viruses for greater genetic and antigenic coverage. The spectrum of HIV-1 serum neutralizing activity seen with the final 12-virus panel closely approximated the activity seen with subtype-matched viruses. Moreover, the final panel was highly sensitive for detection of many of the known broadly neutralizing antibodies. For broader assay applications, all 12 Env clones were converted to infectious molecular clones using a proviral backbone carrying a Renilla luciferase reporter gene (Env.IMC.LucR viruses). This global panel should facilitate highly standardized assessments of vaccine-elicited neutralizing antibodies across multiple HIV-1 vaccine platforms in different parts of the world.

Importance: An effective HIV-1 vaccine will need to overcome the extraordinary genetic variability of the virus, where most variation occurs in the viral envelope glycoproteins that are the sole targets for neutralizing antibodies. Efforts to elicit broadly cross-reactive neutralizing antibodies that will protect against infection by most circulating strains of the virus are guided in part by in vitro assays that determine the ability of vaccine-elicited antibodies to neutralize genetically diverse HIV-1 variants. Until now, little information was available on how many and which strains of the virus are best suited for this purpose. We applied robust statistical methods to evaluate a large neutralization data set and identified a small panel of viruses that are a good representation of the global epidemic. The neutralization properties of this new panel of reference strains should facilitate the development of an effective HIV-1 vaccine.


Figures
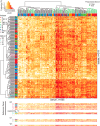
FIG 1
FIG 1
Heat map of 44,758 neutralization results from 205 chronic assayed sera against 219 Env-pseudotyped virus isolates. Positive area under the curve (pAUC) values summarize areas integrated under the dilution curve of each neutralization assay. A color key histogram in the upper left corner summarizes ranges of pAUC values depicted by heat map colors. Low pAUC values (white and lighter-colored cells) indicate no detectable neutralization and relatively weak neutralization, respectively. High pAUC values (orange and red cells) indicate moderate and potent neutralization, respectively. Gray cells indicate 137 missing observations. Colored bands above and to the left of the heat map indicate the subtypes of each serum and virus, respectively. For 34 sera, subtype information was unknown because genome amplification was unsuccessful (NA) (gray bars). Subtypes designated “Other” are noncirculating recombinant forms and two scantly represented CRFs. Leaves on dendrograms are colored to indicate the selection method by which viruses were chosen for the global reference panel (left) and which sera were selected randomly versus those that were prescreened (top). Red dots on dendrograms indicate nodes with at least 60% bootstrap support from 1,000 resampled replicates. Neutralization profiles of isolates selected by quartile-based methods and the additional reference strains are duplicated below the heat map to highlight their neutralization susceptibility. The nine strains selected for the global reference panel using the quartile Q2 (median) are indicated in magenta. The three augmenting strains selected to complete the global reference panel are in blue. Additional strains identified using quartiles Q3 (25th percentile) and Q1 (75th percentile) that were not included in the global reference panel are shown in gray. Names of virus isolates, prefixed by subtype, are (from top to bottom) as follows: Q2, C|CE0217, 01|CNE55, B|TRO11, G|X1632, AC|246F3, 07|CH119, C|CE1176, 07|BJOX2000, and C|25710; Q1, C|3728, B|RPW-0510.2, 07|CH111.8, and 01|C1080.C03; Q3, C|7060101641A7(REV-) and C|DU123.6; and the augmenting strains, B|X2278, 01|CNE8, and A|398F1.
FIG 2
FIG 2
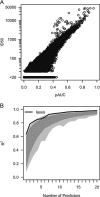
Use of pAUC for comparisons among optimized and randomly selected virus panels. (A) Comparison of pAUC and ID50 values for all 44,758 neutralization results shown in Fig. 1. (B) R2 values for predicting AUC-MB are shown for each of the K predictors per panel. The solid line corresponds to the optimized K isolate panels, with K ranging between 1 and 20, selected using the AUC-MB lasso panel selection method described in Materials and Methods. The dark gray region shows the range of R2 values from the middle 95% of random panels. The light gray region shows the full distribution of R2 values across 1,000 random panels.
FIG 3
FIG 3
An example of predicting the magnitude-breadth curve for one serum. Results are shown for serum 100008 from a chronic HIV-1 subtype C-infected individual who was among the more potent neutralizers. Values along the x axis indicate the magnitude of neutralization potency as positive area under the titration curve (pAUC) values. Values along the y axis indicate neutralization breadth as the cumulative proportion of isolates having neutralization potency (pAUC) no less than the magnitude on the x axis. The prediction target is the magnitude-breadth (MB) curve across 195 viruses assayed with this serum (solid line). Quartiles of the distribution for this serum (Q1, Q2, and Q3) are predicted from 9-isolate panel pAUCs given by Q2. Viruses a to i represent CE0217, CE1176, CH119, CNE55, 25710, TRO11, X1632, BJOX2000, and 246F3, respectively. The predicted MB curve is the logistic function fit to quartile estimates (dashed line). The inset includes the AUC-MB for both the observed and predicted MB curves along with the area between the two curves (ABC).
FIG 4
FIG 4
Magnitude-breadth curves show varied prediction outcomes. Curves are shown for the best, 33rd percentile, 66th percentile, and worst-fit sera, based on ABC from the 9-isolate Q2 panel. The observed MB curves are shown as solid lines. The predicted MB curves appear as dashed lines. Insets report the area between the observed and predicted MB curves (ABC). Serum designations are shown in parentheses above each plot.
FIG 5
FIG 5
The area between curves quantifies the goodness of fit of predicted magnitude-breadth curves for nine-isolate panels. For each selection method, ABC versus the AUC-MB is plotted. A cutoff of ABC equal to 0.05 is indicated with a dashed horizontal line. The top 7% of neutralizers fall to the right of the dashed vertical line. Points that fall above the threshold are open, and those below the threshold are solid. The percentage of sera below the threshold criterion is given above each panel (all are 95.6%).
FIG 6
FIG 6
Ten-fold cross-validation of panel selection. The ABC goodness of fit values are compared across the three panel selection methods based on nine-isolate panels. ABC values for each serum sample are plotted using the full data set (left side of each panel) and for 10-fold cross-validation (CV) data sets (right side of each panel). Box plots are superimposed on the distribution. The midline of the box denotes the median, and the ends of the box denote the 25th and 75th percentiles. The whiskers that extend from the top and bottom of the box extend to the most extreme data points that are no more than 1.5 times the interquartile range.
FIG 7
FIG 7
Influence of highly potent sera on regression. Residual and fitted pAUC values from unconstrained linear regression are depicted for each panel selection method. Highly potent sera appear as solid black circles.
FIG 8
FIG 8
Phylogenetic distribution of Env-pseudotyped viruses with the selected panel shown. Branch colors indicate HIV-1 Env subtypes. This maximum likelihood tree was inferred with PhyML with the HIVb substitution model. It depicts HIV-1 group M diversity and the diverse distribution of virus isolates considered for inclusion in the global panel.
FIG 9
FIG 9
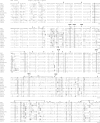
Alignment of deduced amino acid sequences from the 12-isolate global panel of reference Env clones. Nucleotide sequences were translated, aligned, and compared with a consensus of the 12 sequences using Clustal, where the consensus sequence was created with Consensus Maker. Numbering of amino acid residues begins with the first residue of gp120 and does not include the signal peptide. Dashes denote sequence identity, while dots represent gaps introduced to optimize alignments. Capital letters in the consensus sequence indicate 100% sequence conservation. Small letters indicate sites at which fewer than 100% but >50% of the viruses share the same amino acid residue. “?” indicates sites at which fewer than 50% of viruses share a amino acid residue. Triangles above the consensus sequence denote cysteine residues. (Solid triangles indicate sequence identity, while open triangles indicate sequence variation.) V1, V2, V3, V4, and V5 regions designate hypervariable HIV-1 gp120 domains, as previously described. The signal peptide and Env precursor cleavage sites are indicated; “msd” denotes the membrane-spanning domain in gp41. Potential N-linked glycosylation sites (NXYX motif, where X is any amino acid other than proline and Y is either serine or threonine) are shaded gray. Positions of N-linked glycans that are part of broadly neutralizing epitopes are indicated: N156 and N160 (e.g., PG9), N234 and N276 (e.g., 8ANC195 and HJ16), and N301 and N332 (e.g., PGT128). Also shown is the position of a lysine (K) residue in V2 that was a site of immune pressure in RV144. Asterisks are used to show sites that are associated with resistance to broadly neutralizing CD4bs antibodies (HXB2 positions 121, 179, 202, 279, 280, 304, 420, 423, 424, 435, 456, 458, 459, 471, and 474).
FIG 9
FIG 9
Alignment of deduced amino acid sequences from the 12-isolate global panel of reference Env clones. Nucleotide sequences were translated, aligned, and compared with a consensus of the 12 sequences using Clustal, where the consensus sequence was created with Consensus Maker. Numbering of amino acid residues begins with the first residue of gp120 and does not include the signal peptide. Dashes denote sequence identity, while dots represent gaps introduced to optimize alignments. Capital letters in the consensus sequence indicate 100% sequence conservation. Small letters indicate sites at which fewer than 100% but >50% of the viruses share the same amino acid residue. “?” indicates sites at which fewer than 50% of viruses share a amino acid residue. Triangles above the consensus sequence denote cysteine residues. (Solid triangles indicate sequence identity, while open triangles indicate sequence variation.) V1, V2, V3, V4, and V5 regions designate hypervariable HIV-1 gp120 domains, as previously described. The signal peptide and Env precursor cleavage sites are indicated; “msd” denotes the membrane-spanning domain in gp41. Potential N-linked glycosylation sites (NXYX motif, where X is any amino acid other than proline and Y is either serine or threonine) are shaded gray. Positions of N-linked glycans that are part of broadly neutralizing epitopes are indicated: N156 and N160 (e.g., PG9), N234 and N276 (e.g., 8ANC195 and HJ16), and N301 and N332 (e.g., PGT128). Also shown is the position of a lysine (K) residue in V2 that was a site of immune pressure in RV144. Asterisks are used to show sites that are associated with resistance to broadly neutralizing CD4bs antibodies (HXB2 positions 121, 179, 202, 279, 280, 304, 420, 423, 424, 435, 456, 458, 459, 471, and 474).
FIG 10
FIG 10
Neutralization phenotype of the 12-virus global panel as Env-pseudotyped viruses assayed with HIV-1 sera in TZM-bl cells. Shown are the geometric mean titers (GMT) of neutralizing activity of 205 HIV-1 sera assayed against each of 219 Env-pseudotyped viruses. For comparison, a subset of these serum samples was assayed against SF162.LS and BX08.16 as prototypic tier 1A and tier 1B viruses, respectively. The approximate location of each global panel Env-pseudotyped virus is indicated.
FIG 11
FIG 11
Neutralization phenotype of the 12 virus global panel as Env.IMC.LucR viruses assayed with HIV-1 sera in A3R5 cells and TZM-bl cells. Each Env.IMC.LucR virus was assayed in A3R5 (open boxes) and TZM-bl cells (shaded boxes) with serum samples from 14 HIV-1 chronically infected individuals (4 subtype A, 5 subtype B, and 5 subtype C). Boxes extend from the 25th to 75th percentiles of neutralization titers. Horizontal bars are the median titers.

Similar articles

Cited by

References

    1. Mascola JR, Montefiori DC. 2010. The role of antibodies in HIV vaccines. Annu. Rev. Immunol. 28:413–444. 10.1146/annurev-immunol-030409-101256 - DOI - PubMed
    1. Hemelaar J, Gouws E, Ghys PD, Osmanov S. 2011. Global trends in molecular epidemiology of HIV-1 during 2000–2007. AIDS 25:679–689. 10.1097/QAD.0b013e328342ff93 - DOI - PMC - PubMed
    1. Hemelaar J. 2013. Implications of HIV diversity for the HIV-1 pandemic. J. Infect. 66:391–400. 10.1016/j.jinf.2012.10.026 - DOI - PubMed
    1. Seaman MS, Janes H, Hawkins N, Grandpre LE, Devoy C, Giri A, Coffey RT, Harris L, Wood B, Daniels MG, Bhattacharya T, Lapedes A, Polonis VR, McCutchan FE, Gilbert PB, Self SG, Korber BT, Montefiori DC, Mascola JR. 2010. Tiered categorization of a diverse panel of HIV-1 Env pseudoviruses for assessments of neutralizing antibodies. J. Virol. 84:1439–1452. 10.1128/JVI.02108-09 - DOI - PMC - PubMed
    1. Bou-Habib DC, Roderiquez G, Oravecz T, Berman PW, Lusso P, Norcross MA. 1994. Cryptic nature of envelope V3 region epitopes protects primary monocytotropic human immunodeficiency virus type 1 from antibody neutralization. J. Virol. 68:6006–6013 - PMC - PubMed

Publication types

MeSH terms