Comparative Study
. 2014 Feb 15;20(4):1007-19.
doi: 10.1158/1078-0432.CCR-13-1077. Epub 2013 Dec 18.

Distinction between asymptomatic monoclonal B-cell lymphocytosis with cyclin D1 overexpression and mantle cell lymphoma: from molecular profiling to flow cytometry

Affiliations
Comparative Study

Distinction between asymptomatic monoclonal B-cell lymphocytosis with cyclin D1 overexpression and mantle cell lymphoma: from molecular profiling to flow cytometry

Blanca Espinet et al. Clin Cancer Res. .

Abstract

Purpose: According to current diagnostic criteria, mantle cell lymphoma (MCL) encompasses the usual, aggressive variants and rare, nonnodal cases with monoclonal asymptomatic lymphocytosis, cyclin D1-positive (MALD1). We aimed to understand the biology behind this clinical heterogeneity and to identify markers for adequate identification of MALD1 cases.

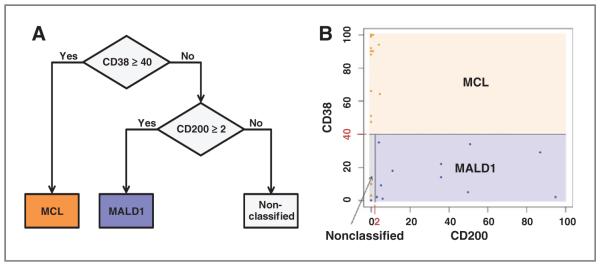
Experimental design: We compared 17 typical MCL cases with a homogeneous group of 13 untreated MALD1 cases (median follow-up, 71 months). We conducted gene expression profiling with functional analysis in five MCL and five MALD1. Results were validated in 12 MCL and 8 MALD1 additional cases by quantitative reverse transcription polymerase chain reaction (qRT-PCR) and in 24 MCL and 13 MALD1 cases by flow cytometry. Classification and regression trees strategy was used to generate an algorithm based on CD38 and CD200 expression by flow cytometry.

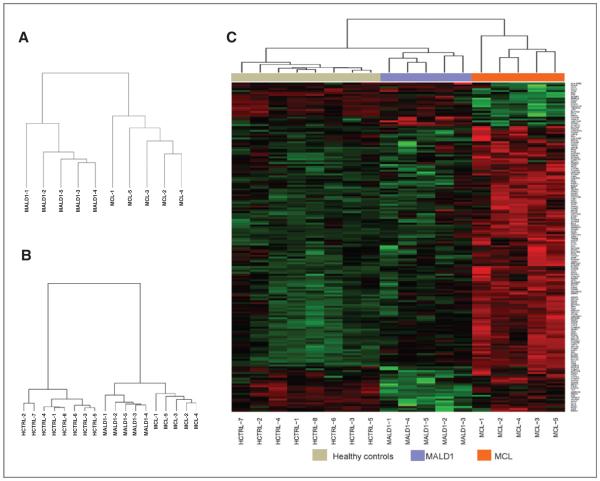
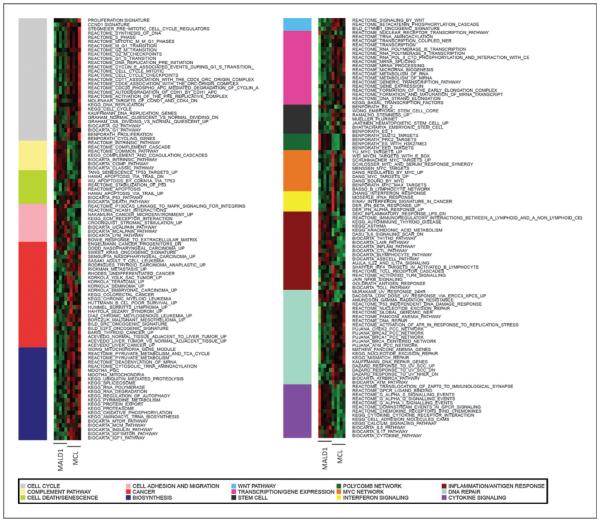
Results: We found 171 differentially expressed genes with enrichment of neoplastic behavior and cell proliferation signatures in MCL. Conversely, MALD1 was enriched in gene sets related to immune activation and inflammatory responses. CD38 and CD200 were differentially expressed between MCL and MALD1 and confirmed by flow cytometry (median CD38, 89% vs. 14%; median CD200, 0% vs. 24%, respectively). Assessment of both proteins allowed classifying 85% (11 of 13) of MALD1 cases whereas 15% remained unclassified. SOX11 expression by qRT-PCR was significantly different between MCL and MALD1 groups but did not improve the classification.

Conclusion: We show for the first time that MALD1, in contrast to MCL, is characterized by immune activation and driven by inflammatory cues. Assessment of CD38/CD200 by flow cytometry is useful to distinguish most cases of MALD1 from MCL in the clinical setting. MALD1 should be identified and segregated from the current MCL category to avoid overdiagnosis and unnecessary treatment.


Figures

Figure 1
Figure 1
MALD1 participate in immune reactions. Top, chronic gastritis in a MALD1 case. A, lymphoid follicles formation in the lamina propria (HE; ×20). B, main image: numerous lymphoid cells overexpressing cyclin D1 in the mantle zone (IHC; ×20); inset: boundary between the germinal center and mantle zone (IHC; ×700). C, abundant H. pylori in the lumen of the gastric pits (Giemsa; ×900). Bottom, posttreatment study of the same case. D, mild mucosal atrophy without inflammation (HE; ×40). E, absence of lymphoid cells expressing cyclin D1 (IHC; ×40). F, absence of H. pylori in the lumen of the gastric pits (Giemsa; ×900).
Figure 2
Figure 2
Gene expression analysis of CD19+ peripheral blood B cells reveals significant differences between MALD1 and MCL. A, unsupervised hierarchical clustering of the gene expression profiles (GEP) from healthy controls (HCTRL), MALD1, and MCL cases. B, unsupervised hierarchical clustering of GEP from MALD1 and MCL cases separates the 2 entities based on distinct gene signatures. C, heatmap showing the results of the supervised analysis using genes differentially expressed between MALD1 and MCL cases. The list of genes appearing in the heatmap is detailed, in order of appearance, in Supplementary Table S4.
Figure 3
Figure 3
Biologic pathways differentiate MALD1 and MCL cells. Functional heatmap showing relative enrichment of biologic pathways in the 2 groups. This heatmap was generated by aggregating results of the GSEA and IPA analyses in common categories and taking the mean of gene expression in each pathway as the representative value for each sample.
Figure 4
Figure 4
Differences in CD38 and CD200 surface protein and mRNA expression between MALD1 and MCL cases. A, box plots representing the mRNA expression levels of CD38 in the 2 groups, as determined by qRT-PCR and expressed in relative units (Mann–Whitney test). B, box plots depicting the distribution of CD38-positive cells within the clonal peripheral blood B-cell population in the 2 groups (Mann–Whitney test), as assessed by flow cytometry. C, representative examples of flow cytometry analysis of CD38 surface expression in representative MALD1 (top) and MCL (bottom) peripheral blood B cells (CD19+, CD5+, highlighted in red on the right). The mean fluorescence intensity is used as a parameter to plot the levels of CD38 expression (histograms). D, box plot representation of CD200 mRNA total levels in MALD1 and MCL cases and expressed in relative units (Mann–Whitney test). E, box plots depicting the distribution of CD200-positive cells within the clonal peripheral blood B-cell population in the 2 groups (Mann–Whitney test), as assessed by flow cytometry. F, representative examples of flow cytometric analysis of CD200 surface expression in representative MALD1 (top) and MCL (bottom) peripheral blood B cells (highlighted in red) using the mean fluorescence intensity as a parameter (histograms).
Figure 5
Figure 5
CD38 and CD200 surface expression are helpful to discriminates between MCL and MALD1. A, resulting decision tree graph based on CD38 and CD200 expression assessed by flow cytometry classifies cases in 3 groups: MCL, MALD1, and non-classified. B, graphical distribution of studied cases depicted in blue (MALD1) and orange (MCL). Blue box corresponds to MALD1 assigned group by the tree, orange box corresponds to MCL assigned group, and gray box to the non-classified group.

Similar articles

Cited by

References

    1. Swerdlow SH, Campo E, Seto M, Muüller-Hermelink HK, Swerdlow SH, Campo E, Harris NL, Jaffe ES, Pileri SA, Stein H, Thiele J, Vardiman JW. World Health Organization classification of tumours of haematopoietic and lymphoid tissues. IARC Press; Lyon, France: 2008. Mantle cell lymphoma; pp. 229–32.
    1. Campo E, Raffeld M, Jaffe ES. Mantle-cell lymphoma. Semin Hematol. 1999;36:115–27. - PubMed
    1. Hinds PW, Dowdy SF, Eaton EN, Arnold A, Weinberg RA. Function of a human cyclin gene as an oncogene. Proc Natl Acad Sci U S A. 1994;91:709–13. - PMC - PubMed
    1. Gladden AB, Woolery R, Aggarwal P, Wasik MA, Diehl JA. Expression of constitutively nuclear cyclin D1 in murine lymphocytes induces B-cell lymphoma. Oncogene. 2006;25:998–1007. - PMC - PubMed
    1. Herrmann A, Hoster E, Zwingers T, Brittinger G, Engelhard M, Meusers P, et al. Improvement of overall survival in advanced stage mantle cell lymphoma. J Clin Oncol. 2009;27:511–8. - PubMed

Publication types