. 2014 Feb 7;289(6):3639-51.
doi: 10.1074/jbc.M113.523704. Epub 2013 Dec 18.

Evidence for hysteretic substrate channeling in the proline dehydrogenase and Δ1-pyrroline-5-carboxylate dehydrogenase coupled reaction of proline utilization A (PutA)

Affiliations

Evidence for hysteretic substrate channeling in the proline dehydrogenase and Δ1-pyrroline-5-carboxylate dehydrogenase coupled reaction of proline utilization A (PutA)

Michael A Moxley et al. J Biol Chem. .

Abstract

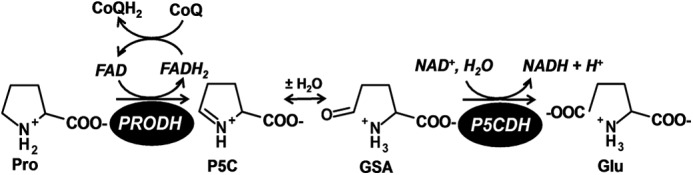
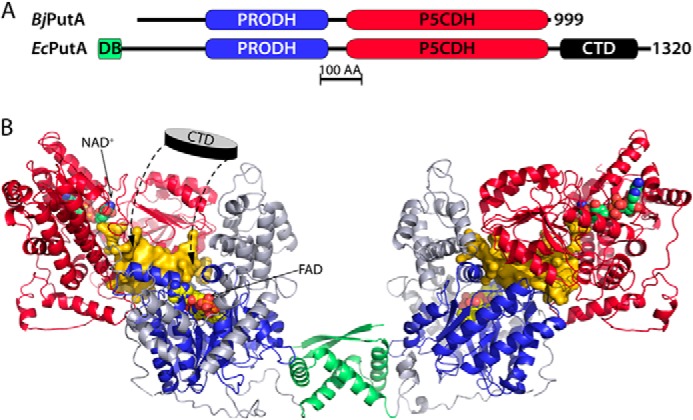
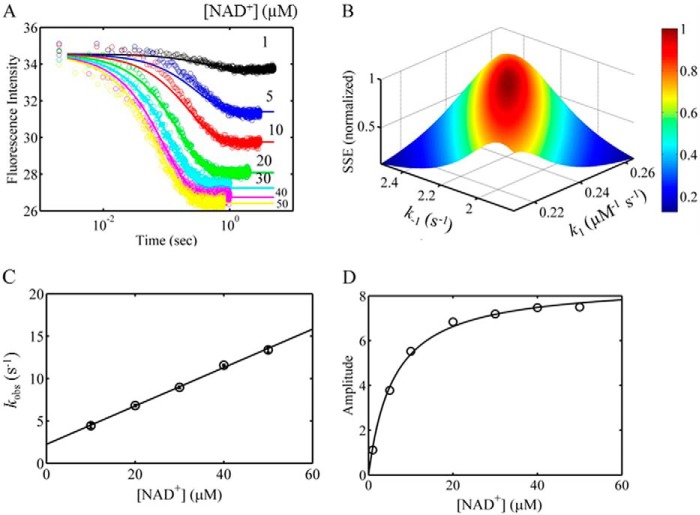
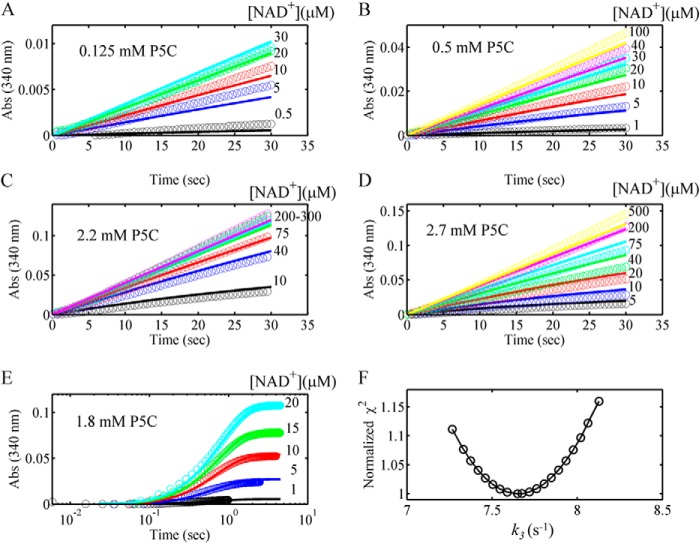
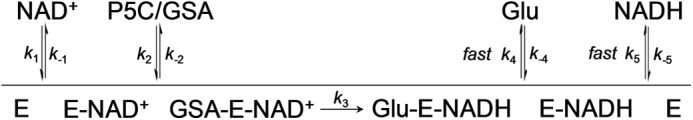
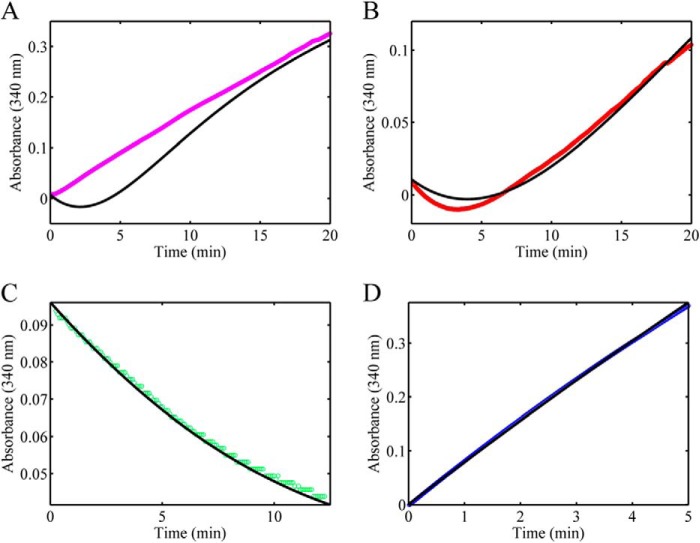
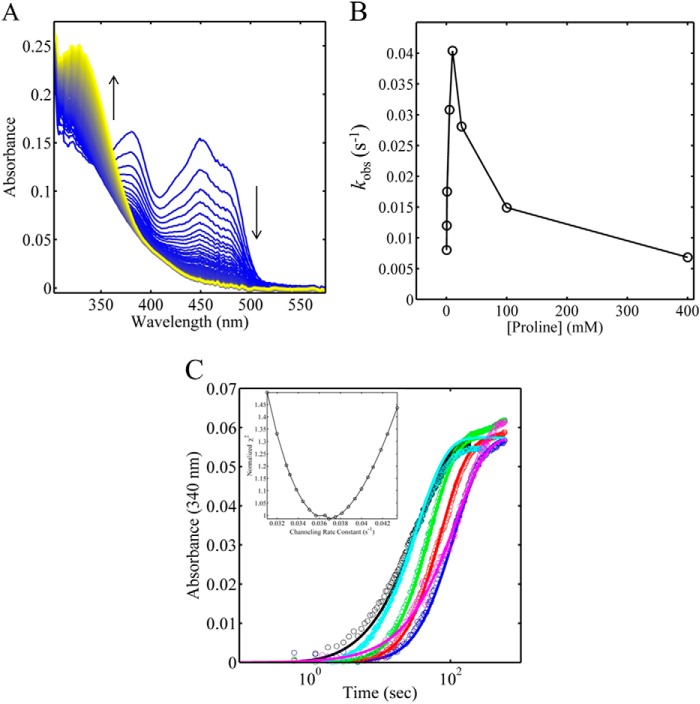
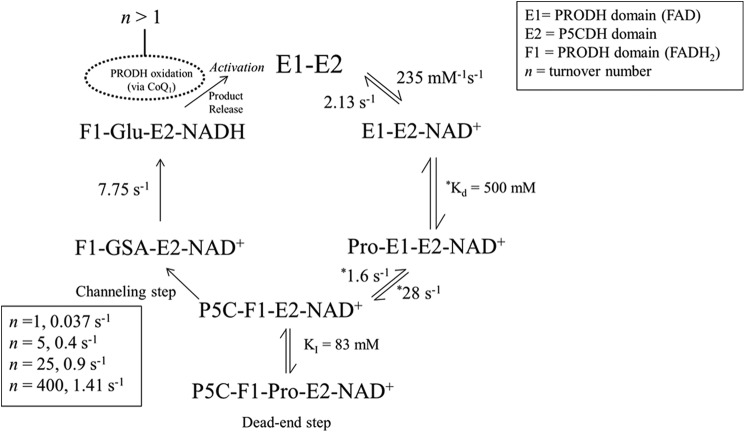
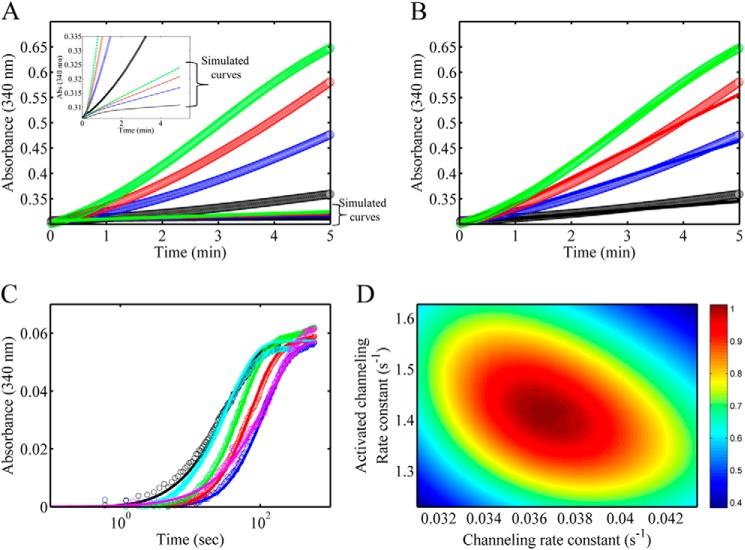
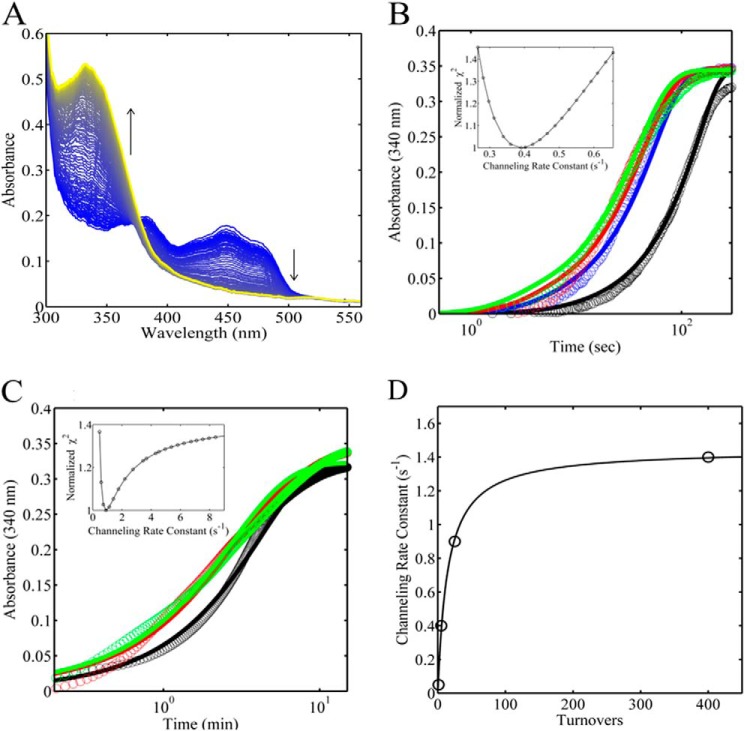
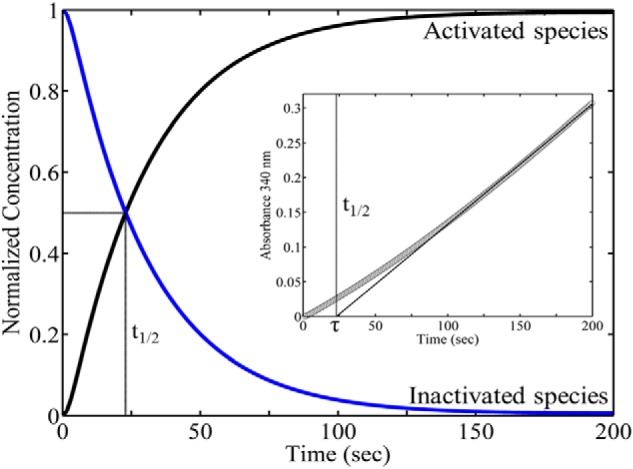
PutA (proline utilization A) is a large bifunctional flavoenzyme with proline dehydrogenase (PRODH) and Δ(1)-pyrroline-5-carboxylate dehydrogenase (P5CDH) domains that catalyze the oxidation of l-proline to l-glutamate in two successive reactions. In the PRODH active site, proline undergoes a two-electron oxidation to Δ(1)-pyrroline-5-carboxlylate, and the FAD cofactor is reduced. In the P5CDH active site, l-glutamate-γ-semialdehyde (the hydrolyzed form of Δ(1)-pyrroline-5-carboxylate) undergoes a two-electron oxidation in which a hydride is transferred to NAD(+)-producing NADH and glutamate. Here we report the first kinetic model for the overall PRODH-P5CDH reaction of a PutA enzyme. Global analysis of steady-state and transient kinetic data for the PRODH, P5CDH, and coupled PRODH-P5CDH reactions was used to test various models describing the conversion of proline to glutamate by Escherichia coli PutA. The coupled PRODH-P5CDH activity of PutA is best described by a mechanism in which the intermediate is not released into the bulk medium, i.e., substrate channeling. Unexpectedly, single-turnover kinetic experiments of the coupled PRODH-P5CDH reaction revealed that the rate of NADH formation is 20-fold slower than the steady-state turnover number for the overall reaction, implying that catalytic cycling speeds up throughput. We show that the limiting rate constant observed for NADH formation in the first turnover increases by almost 40-fold after multiple turnovers, achieving half of the steady-state value after 15 turnovers. These results suggest that EcPutA achieves an activated channeling state during the approach to steady state and is thus a new example of a hysteretic enzyme. Potential underlying causes of activation of channeling are discussed.

Keywords: Enzyme Kinetics; Enzyme Mechanisms; Enzyme Turnover; Flavin; Hysteresis; Metabolism; Proline; Substrate Channeling.


Figures

FIGURE 1.
FIGURE 1.
Reactions catalyzed by the PRODH and P5CDH domains of PutA.
FIGURE 2.
FIGURE 2.
EcPutA structural model. A, domain diagrams for the small PutA from B. japonicum (BjPutA) and the trifunctional PutA from E. coli (EcPutA). B, model of the EcPutA dimer from reference (20), which is based on small angle x-ray scattering, crystal structures of EcPutA DNA-binding and PRODH domains, and homology to BjPutA. The DNA-binding, PRODH, and P5CDH domains are colored as in the domain diagram. The gold surface represents the substrate-channeling cavity. The C-terminal domain (CTD), whose structure is unknown, is depicted as a lid that covers the substrate-channeling cavity.
FIGURE 3.
FIGURE 3.
Stopped flow kinetics of NAD+ binding to EcPutA. A, EcPutA (2 μm after mixing) was rapidly mixed with varying concentrations of NAD+ (after mixing) as annotated and followed by EcPutA fluorescence quenching (excited at 280 nm). Circles represent experimental data. Solid curves represent fits to a simple binding model that includes only association and dissociation steps. B, the FitSpace for the model of NAD+ binding to EcPutA. The z axis represents the SSE between the model and the data, normalized so that the best fit gives a value of 1 (30). Best fit values as well as confidence intervals are reported in Table 1. C, observed first order rate constants extracted from the data in A by fitting to a single exponential equation (NAD concentrations of 1 and 5 μm were omitted to adhere to pseudo first order conditions for analytical fitting). The linear fit assumes a simple binding model (55), yielding an association rate constant (k1) of 0.226 μm−1 s−1 from the slope and a dissociation rate constant (k−1) of 2.24 s−1 from the y intercept. D, amplitudes extracted from the data in A by fitting to a single exponential equation. The hyperbolic fit yields a dissociation constant (Kd) of 5 μm.
FIGURE 4.
FIGURE 4.
Steady-state and single-turnover analysis of the P5CDH activity of EcPutA globally fitted to an ordered ternary mechanism. A–D, steady-state progress curves of EcPutA P5CDH activity followed at 340 nm with varying NAD+ concentrations at different fixed concentrations of exogenously added (DL)-P5C (L-P5C concentration shown). Experimental data are represented by open circles. The solid curves represent the results of global fitting of all the steady-state data and the single-turnover data shown in E to an ordered ternary mechanism (shown in Fig. 5). E, single-turnover progress curves of EcPutA P5CDH activity followed at 340 nm. EcPutA (20 μm after mixing) was rapidly mixed with varying concentrations of NAD+ using a fixed concentration of exogenous (DL)-P5C (L-P5C, 1.8 mm). The experimental data are represented by open circles. The solid curves represent the results of global fitting of all the steady-state data from A–D along with the single-turnover data to an ordered ternary mechanism (Fig. 5). F, one-dimensional FitSpace (30) of the chemical step (k3) from global fitting of the data in A–E to an ordered ternary mechanism, with the SSE normalized to one. The resulting best fit rate constants and confidence intervals are shown in Table 1.
FIGURE 5.
FIGURE 5.
Ordered ternary mechanism used for global fitting of the steady-state and single-turnover data of EcPutA P5CDH activity with exogenous L-P5C/GSA.
FIGURE 6.
FIGURE 6.
Steady-state reaction progress curves of coupled PRODH and P5CDH activity for WT and mixed variant EcPutA analyzed according to a nonchanneling mechanism. A, steady-state assay of WT EcPutA (0.5 μm) containing 0.1 mm CoQ1, 0.2 mm NAD+, and 40 mm proline followed at 340 nm (data in magenta). A simulated progress curve (black line) for a nonchanneling mechanism generated from rate constants determined previously for WT EcPutA PRODH activity and P5CDH activity is also plotted (17). The poor fit of the data to the model is consistent with a substrate channeling mechanism for WT EcPutA. B, steady-state assay containing equimolar amounts of the EcPutA mutants R556M and C917A (0.2 μm), also referred to as mixed variants, with 0.1 mm CoQ1, 0.2 mm NAD+, and 40 mm proline followed at 340 nm (data in red). A simulated progress curve (black line) for a nonchanneling mechanism as described in A is also plotted (17). The good fit of the data to the model is consistent with a lack of substrate channeling for the mixed variants system. C, the EcPutA mutant C917A was assayed for PRODH activity by following the reduction of CoQ1 at 340 nm in the presence of 0.1 mm CoQ1, 40 mm proline, and 0.2 μm C917A enzyme. Data (green circles) were plotted against a simulated progress curve (black line) using rate constants determined previously for WT EcPutA PRODH activity (17). The excellent fit verifies that mutation of Cys-917 to Ala does not affect the PRODH activity. D, the EcPutA mutant R556M was assayed for P5CDH activity by following the reduction of NAD+ at 340 nm in the presence of 0.2 mm NAD+, 0.6 mm L-P5C, and 0.2 μm R556M enzyme. The data (blue circles) were plotted against a simulated progress curve (black line) using rate constants determined here for WT EcPutA P5CDH activity (Table 1). The excellent fit verifies that mutation of Arg-556 to Met does not affect the P5CDH activity.
FIGURE 7.
FIGURE 7.
Single-turnover experiment of EcPutA coupled PRODH-P5CDH activity. A, EcPutA (12 μm after mixing) was rapidly mixed with 25 mm proline and 0.2 mm NAD+ (concentrations after mixing) in anaerobic conditions, and absorbance changes were followed using a photodiode array detector. B, the observed first order rate constants obtained by fitting the absorbance at 340 nm from multiwavelength data of the coupled PRODH-P5CDH reaction at different proline concentrations to a single exponential equation (not shown). C, single wavelength traces at 340 nm from multiwavelength data of the coupled PRODH-P5CDH reaction at different proline concentrations were fitted to a channeling model (Fig. 8) using previously determined mechanisms and rate constants for EcPutA PRODH activity (17) and P5CDH activity described here. Proline concentrations after mixing were 0.25 (blue), 0.5 (red), 1 (green), 5 (black), 25 (cyan), and 400 mm (pink), where data are shown as colored circles, and the predicted traces are represented by the corresponding colored curves. The inset shows a one-dimensional parameter scan of the channeling rate constant where the y axis is the normalized ratio χ22min (30). Best fit rate constants and confidence intervals are reported in Table 3.
FIGURE 8.
FIGURE 8.
Channeling model used for fitting PRODH-P5CDH coupled activity in WT EcPutA with best fit rate constants and equilibrium constants shown for each step. E1, oxidized PRODH active site; E2, P5CDH active site; F1, reduced PRODH active site. The parameter n represents the number of catalytic turnovers. Rate constants marked with an asterisk were determined in a previous publication (17). A single-turnover experiment is described by this mechanism with n = 1 and is performed in the absence of CoQ1 and O2 so that the oxidized PRODH active site is not regenerated. The dependence of the channeling rate constant on n is determined with defined multiple turnover experiments, which are performed by including CoQ1 as the limiting reagent at a concentration of [CoQ1] = n[EcPutA]. Confidence intervals for the proposed channeling step through each turnover are given in Table 3.
FIGURE 9.
FIGURE 9.
Hysteretic behavior of the EcPutA PRODH-P5CDH coupled reaction. A, steady-state progress curves of EcPutA (0.5 μm) PRODH-P5CDH coupled activity with 1 mm (black circles), 5 mm (blue circles), 10 mm (red circles), and 20 mm proline (green circles) using 0.2 mm NAD+ and 0.3 mm CoQ1. Also plotted are the simulated progress curves (shown as solid lines of the corresponding color) for the steady-state assay conditions using the mechanism in Fig. 8 and a rate constant for the proposed channeling step determined from the EcPutA single-turnover channeling experiment (n = 1, 0.037 s−1). The inset shows a zoomed-in view of the large discrepancy between the observed and simulated progress curves. This large discrepancy indicates that the single-turnover channeling rate constant is inconsistent with the steady-state kinetics. B, steady-state progress curves as shown in A globally fitted to the mechanism shown in Fig. 8 with the rate constant for the channeling step allowed to increase during subsequent enzyme turnovers (n > 1). The data are shown as colored circles, and the predicted curves are shown as lines colored according to the corresponding data. C, EcPutA single-turnover channeling data as shown in Fig. 7C but globally fitted here along with the steady-state data in B to the mechanism in Fig. 8 allowing for activation of the channeling step. The fitting shows that stopped flow and steady-state data can be reconciled by allowing the rate constant for the proposed channeling step to increase during catalytic cycling. D, FitSpace of the global fitting of the steady-state data shown in B and the single-turnover data shown in C to the model shown in Fig. 8, which includes activation of the proposed channeling step after the first turnover. The effect of varying the channeling rate constant in the first turnover and the activated channeling rate constant in subsequent turnovers on the SSE is shown. Best fit rate constants and confidence intervals are reported in Table 3.
FIGURE 10.
FIGURE 10.
Anaerobic multiple-turnover experiments of the EcPutA PRODH-P5CDH coupled reaction. A, EcPutA (10 μm) was rapidly mixed with 250 μm NAD+, 50 μm CoQ1, and 10 mm proline (concentrations after mixing), and absorbance changes were monitored with a photodiode array detector. B, multiwavelength data as in A were collected with different concentrations of proline 1 (black), 5 (blue), 10 (red), and 25 (green) mm (all final concentrations) and analyzed at 340 nm. The data are represented by colored circles, and the model predictions are represented by lines of the corresponding color. The data were fitted to the mechanism in Fig. 8 that included constrained rate constants for PRODH activity determined previously (17) and P5CDH activity rate constants determined in this study. The inset shows the variation of the normalized SSE between the model and the data as the channeling rate constant is varied. C, EcPutA (2 μm after mixing) was mixed with 250 μm NAD+, 50 μm CoQ1 with different concentrations of proline 1 (black), 5 (red), and 10 (green) mm (all final concentrations). Single wavelength traces at 340 nm are shown where data are represented by colored circles, and the model predictions are represented by curves of the corresponding color. These data were fitted to the mechanism in Fig. 8 as described for the data shown in B. The inset shows the variation of the normalized SSE between the model and the data as the channeling rate constant is varied. D, dependence on the channeling rate constant on the number of enzyme turnovers, n. The channeling rate constant for n = 1 is from the single-turnover experiment shown in Fig. 7. The value for n = 400 is from the steady-state data shown in Fig. 9. The values for n = 5 and n = 25 are from the data shown in B and C, respectively. For n > 1, turnover numbers are estimated by dividing the concentration of the limiting reagent (CoQ1) by the concentration of the enzyme. Fitting to a hyperbola indicates that the channeling rate constant reaches its half-maximal value after 15 turnovers (n = 15).
FIGURE 11.
FIGURE 11.
Simulation of the time-dependent activation of the channeling step in EcPutA. EcPutA PRODH-P5CDH coupled activity was simulated using the rate constants described in this study. The concentrations of activated and inactivated enzyme species in a coupled PRODH-P5CDH assay with 10 mm proline, 0.2 mm NAD+, and 0.3 mm CoQ1 are shown as black and blue lines, respectively (both are normalized by the total enzyme concentration). Inset, EcPutA PRODH-P5CDH coupled progress curve data with the same substrate concentrations used for the simulation in the main figure (the progress curve was corrected for CoQ1 absorbance at 340 nm). The linear portion of the progress curve was fitted to a line and is extrapolated to the x axis so that the intersection gives the transient time (τ = 23.47 s) to reach steady state (26, 27). The black line segments in the figure mark the t½ (22.91 s) for activation of EcPutA. Note that the transient time to reach steady state in the coupled PRODH-P5CDH channeling reaction is similar to t½ for activation of EcPutA.

Similar articles

Cited by

References

    1. Szabados L., Savouré A. (2010) Proline. A multifunctional amino acid. Trends Plant Sci. 15, 89–97 - PubMed
    1. Phang J. M., Liu W., Zabirnyk O. (2010) Proline metabolism and microenvironmental stress. Annu. Rev. Nutr. 30, 441–463 - PMC - PubMed
    1. Liang X., Zhang L., Natarajan S. K., Becker D. F. (2013) Proline mechanisms of stress survival. Antioxid. Redox Signal. 19, 998–1011 - PMC - PubMed
    1. Liu W., Le A., Hancock C., Lane A. N., Dang C. V., Fan T. W., Phang J. M. (2012) Reprogramming of proline and glutamine metabolism contributes to the proliferative and metabolic responses regulated by oncogenic transcription factor c-MYC. Proc. Natl. Acad. Sci. U.S.A. 109, 8983–8988 - PMC - PubMed
    1. Natarajan S. K., Zhu W., Liang X., Zhang L., Demers A. J., Zimmerman M. C., Simpson M. A., Becker D. F. (2012) Proline dehydrogenase is essential for proline protection against hydrogen peroxide-induced cell death. Free Radic. Biol. Med. 53, 1181–1191 - PMC - PubMed

Publication types

MeSH terms

LinkOut - more resources