. 2014 Jan;141(2):296-306.
doi: 10.1242/dev.099747. Epub 2013 Dec 18.

Fgf10-positive cells represent a progenitor cell population during lung development and postnatally

Affiliations

Fgf10-positive cells represent a progenitor cell population during lung development and postnatally

Elie El Agha et al. Development. 2014 Jan.

Abstract

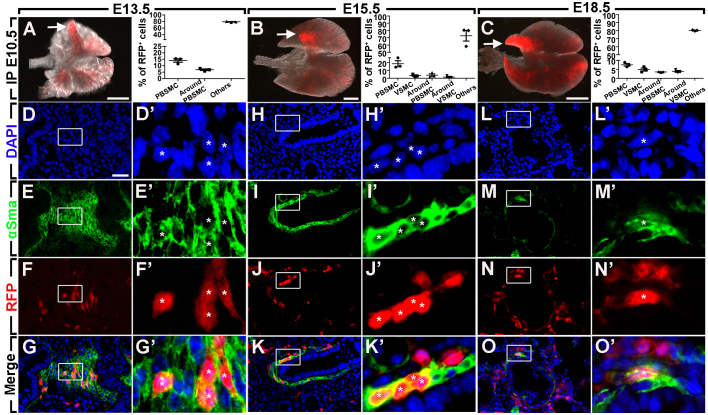
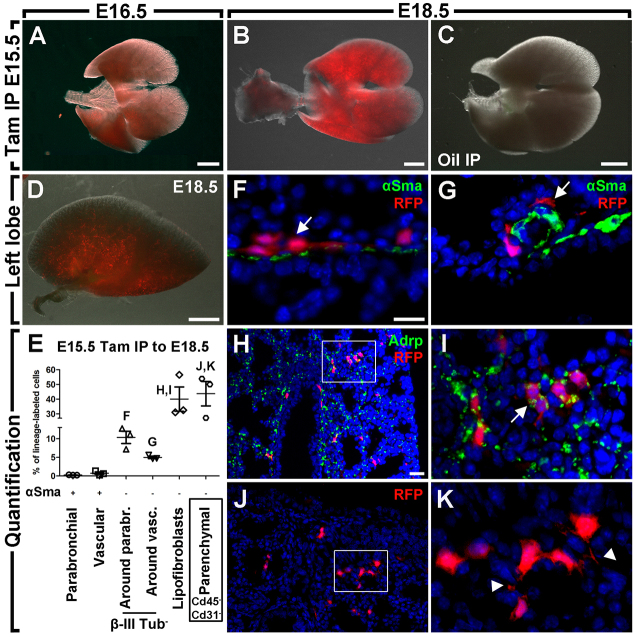
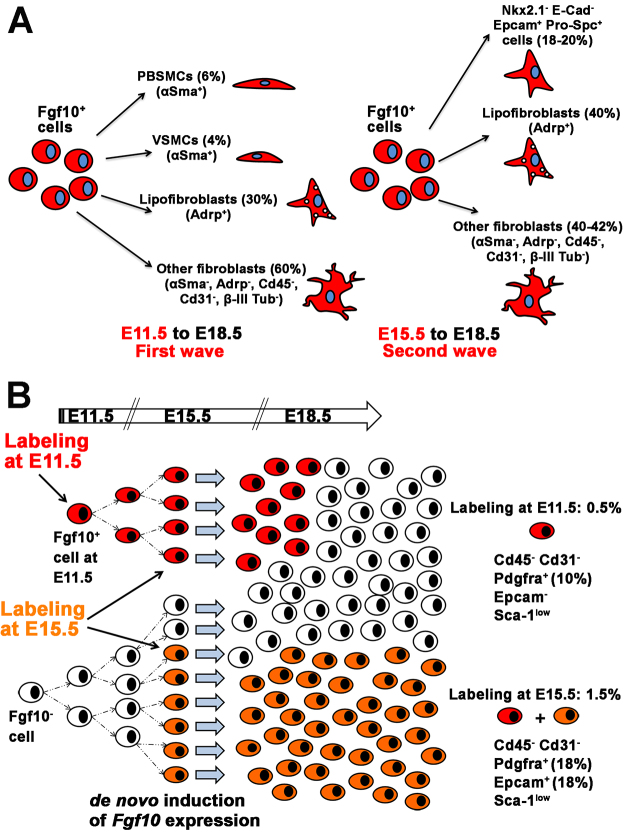
The lung mesenchyme consists of a widely heterogeneous population of cells that play crucial roles during development and homeostasis after birth. These cells belong to myogenic, adipogenic, chondrogenic, neuronal and other lineages. Yet, no clear hierarchy for these lineages has been established. We have previously generated a novel Fgf10(iCre) knock-in mouse line that allows lineage tracing of Fgf10-positive cells during development and postnatally. Using these mice, we hereby demonstrate the presence of two waves of Fgf10 expression during embryonic lung development: the first wave, comprising Fgf10-positive cells residing in the submesothelial mesenchyme at early pseudoglandular stage (as well as their descendants); and the second wave, comprising Fgf10-positive cells from late pseudoglandular stage (as well as their descendants). Our lineage-tracing data reveal that the first wave contributes to the formation of parabronchial and vascular smooth muscle cells as well as lipofibroblasts at later developmental stages, whereas the second wave does not give rise to smooth muscle cells but to lipofibroblasts as well as an Nkx2.1(-) E-Cad(-) Epcam(+) Pro-Spc(+) lineage that requires further in-depth analysis. During alveologenesis, Fgf10-positive cells give rise to lipofibroblasts rather than alveolar myofibroblasts, and during adult life, a subpopulation of Fgf10-expressing cells represents a pool of resident mesenchymal stromal (stem) cells (MSCs) (Cd45(-) Cd31(-) Sca-1(+)). Taken together, we show for the first time that Fgf10-expressing cells represent a pool of mesenchymal progenitors in the embryonic and postnatal lung. Our findings suggest that Fgf10-positive cells could be useful for developing stem cell-based therapies for treating interstitial lung diseases.

Keywords: Fgf10-positive cells; Lineage tracing; Lung mesenchyme; Mouse; Resident MSCs.


Figures

Fig. 1.
Fig. 1.
Time-lapse imaging of E12.5 lungs from Fgf10iCre/+; tomatoflox/+ embryos. (A) Schematic of the Fgf10 locus in Fgf10iCre knock-in mice. Recombination was induced in vivo by a single IP injection of tamoxifen at E11.5. (B-E) Brightfield imaging of an E12.5 Fgf10iCre/+; tomatoflox/+ lung undergoing branching morphogenesis. (B′-E′) Whole-mount fluorescence imaging showing the progressive amplification and migration of lineage-labeled cells. Note the high tomato expression in the accessory lobe at t=0 hour. (B′-E′) Overlay of brightfield and fluorescent images. (F-I) Immunofluorescent detection of αSma (green) in the lung after 72 hours of culture. The areas in white boxes are magnified in F′-I′. A subpopulation of lineage-labeled cells lies in the PBSMC layer (white arrows in I′). (J) Quantification of the RFP signal over time. (K) Quantification of lineage-labeled cells after αSma immunostaining. n=3. Data are shown as average values ± s.e.m. Scale bars: 500 μm (B-E); 75 μm (F-I). BF, brightfield.
Fig. 2.
Fig. 2.
Contribution of Fgf10-positive cells labeled at E10.5 to the parabronchial smooth muscle lineage in vivo. (A-C) Overlay of brightfield and whole-mount fluorescent images of the lung at E13.5, E15.5 and E18.5. Note the strong RFP signal in the accessory lobe at all three stages (white arrows). The right panels in A-C show the quantification of multiple RFP+ populations based on αSma staining for each stage. (D-O) Single-channel and merged images of αSma staining (green) of the accessory lobes of the lungs from the upper panel showing RFP-positive cells (red) in the PBSMC layer at all three stages (asterisks). The areas in the white boxes are magnified in D′-O′. n=3. Data are shown as average values ± s.e.m. Scale bars: 500 μm (A); 1000 μm (B); 750 μm (C); 25 μm (D-O).
Fig. 3.
Fig. 3.
In vivo lineage tracing of Fgf10-positive cells labeled at E11.5. (A-C) Overlay of brightfield and whole-mount fluorescent images of the lung at E12.5, E15.5 and E18.5. (D) The total number of RFP+ cells in the lungs shown in A-C increases drastically over time, as determined by FACS analysis. (E) Quantification of RFP-positive populations. (F) Overlay of brightfield and whole-mount fluorescent images of the left lung lobe at E18.5. (G-I) αSma staining showing RFP-positive cells in the PBSMC layer (G), vascular walls (H) and around PBSMCs (I). (J) Immunofluorescence staining showing an Adrp+ RFP+ cell. (K) Big RFP-positive cells with filopodia (arrowheads) are present in the lung parenchyma. n=3. Data are shown as average values ± s.e.m. ***P<0.001 (one-way ANOVA). Scale bars: 250 μm (A); 1000 μm (B,C); 500 μm (F); 12.5 μm (G-K). Epi, epithelium; v, vessel.
Fig. 4.
Fig. 4.
In vivo lineage tracing of Fgf10-positive cells labeled at E15.5. (A,B) Overlay of brightfield and whole-mount fluorescent images of the lung at E16.5 and E18.5. The RFP signal is more intense at E18.5 than at E16.5. (C) Overlay of brightfield and whole-mount fluorescent images of an E18.5 Fgf10iCre/+; tomatoflox/+ lung exposed to corn oil instead of tamoxifen. (D) Overlay of brightfield and whole-mount fluorescent images of the left lung lobe at E18.5. (E) Quantification of RFP-positive populations. (F,G) αSma staining showing αSma- RFP+ cells around PBSMCs and VSMCs. (H,I) Adrp immunostaining showing Adrp+ RFP+ cells. The area in the white box is magnified in I. (J,K) Big RFP-positive cells with filopodia (arrowheads) are present in the lung parenchyma. The area in the white box is magnified in K. n=3. Data are shown as average values ± s.e.m. Scale bars: 750 μm (A,D); 1000 μm (B,C); 12.5 μm (F,G,I,K); 25 μm (H,J).
Fig. 5.
Fig. 5.
Fgf10-positive cells preferentially give rise to lipofibroblasts rather than alveolar myofibroblasts during alveologenesis. Nursing female mice were fed tamoxifen-containing pellets from P2 to P14. (A) Overlay of brightfield and whole-mount fluorescent images of the left lung lobe from an Fgf10+/+; tomatoflox/+ pup. (B,C) Representative image of the left lung lobe from Fgf10iCre/+; tomatoflox/+ pups. Note the strong tomato signal around the mainstem bronchus (C; higher magnification of the boxed area in B). (D,E) Immunostaining for αSma showing an αSma- RFP+ cell. The area in the dashed box is magnified in E. The asterisks mark alveolar myofibroblasts in the secondary septa. (F,G) Immunostaining for αSma showing an αSma+ RFP+ cell (white arrow). The area in the dashed box is magnified in G. (H) Single-channel fluorescent images of the αSma+ RFP+ cell shown in G. (I,J) Immunostaining for Adrp showing an Adrp+ RFP+ cell. The area in the dashed box is magnified in J. (K) Single-channel fluorescent images of the Adrp+ RFP+ cell shown in J. (L) Immunostaining for αSma of an Fgf10+/+; tomatoflox/+ lung. (M) Quantification of lineage-labeled cells according to αSma and Adrp expression. n=3. Data are shown as average values ± s.e.m. Scale bars: 2.5 mm (A,B); 750 μm (C); 25 μm (D-L).
Fig. 6.
Fig. 6.
Flow cytometry analysis of the Fgf10-expressing lineage during embryonic development and postnatally. (A) E18.5 lungs from Fgf10+/+; tomatoflox/+ embryos show no tomato signal. (B,C) Tomato-positive cells account for ∼0.5% and ∼1.5% of the total E18.5 lung suspension when labeled at E11.5 and E15.5, respectively. (D) RT-PCR and immunostaining of sorted Fgf10-positive cells (labeled at E15.5) show high expression of Adrp (white arrows). Note the presence of Adrp- cells (asterisk). (E,F) Almost all Fgf10-expressing cells labeled at E11.5 express low levels of Sca-1 (Sca-1low) (E) and ∼9.9% of these cells co-express Pdgfra (F). (G) Almost all Fgf10-expressing cells labeled at E15.5 express low levels of Sca-1 (Sca-1low) and ∼18.1% of these cells co-express Epcam. (H) ∼17.5% of lineage-labeled cells express Pdgfra. (I,J) Section of an E15.5 Fgf10iCre/+; tomatoflox/+ lung (labeled at E11.5) showing Pdgfra expression (green). The area in the white box is magnified in J. White arrows indicate RFP+ Pdgfra+ cells and the dashed line marks the epithelial-mesenchymal boundary. (K) Lungs from Fgf10+/+; tomatoflox/+ adult mice show no tomato signal when exposed to tamoxifen. (L) Tomato-positive cells account for ∼0.1% of the total adult lung. (M) ∼15.7% and ∼22.8% of lineage-labeled cells express Epcam and Sca-1, respectively. (N) A subpopulation of Fgf10-expressing cells (∼10.5%) shows the molecular signature of resident MSCs. (O) Tomato-positive cells from E11.5 are retained at P30, and account for ∼0.4% of the total lung. (P) ∼11.1% total RFP+ cells express Sca-1 whereas minimal overlap with Epcam expression can be detected. (Q,R) ∼4.9% of total tomato-positive cells are resident MSCs (Q) and the majority (∼83.7%) of total labeled cells contains neutral lipids (R). (S-U) Whole-mount fluorescence images of lungs from P30 mice that were exposed to corn oil or tamoxifen at E11.5. Note the absence of tomato expression in corn-oil-exposed lungs. The accessory lobe of the tamoxifen-exposed lung shown in T is shown in U. Note the strong tomato signal at the tip of this lobe. (V) Summary of the flow cytometry analysis of the Fgf10-expressing lineage during embryonic lung development and postnatally. n≥2. Scale bars: 25 μm (D); 100 μm (I); 12.5 μm (J); 5 mm (S,T); 2.5 mm (U). Epi, epithelium.
Fig. 7.
Fig. 7.
Epcam+ lineage-labeled cells do not represent an epithelial lineage in the lung. (A-B′) Immunofluorescence staining of sorted Fgf10-positive cells (labeled at E15.5 and harvested at E18.5) showing E-Cad- Pro-Spc+ RFP+ cells. The areas in the white boxes are magnified in A′,B′. The white arrows indicate Pro-Spc+ RFP+ cells. (C,C′) Immunofluorescence staining of lung cryosections (exposed to tamoxifen at E15.5 and harvested at E18.5) showing Pro-Spc+ RFP+ cells in the lung mesenchyme. (D,D′) Immunofluorescence staining of lung sections showing E-Cad- RFP+ cells. The areas in the white boxes in C,D are magnified in C′,D′. The white arrows indicate Pro-Spc+ RFP+ cells. (E) RT-PCR on sorted cells (labeled at P2 and harvested at P30) showing that Epcam+ RFP+ cells co-express Spc, but not Nkx2.1 or E-Cad whereas Epcam+ RFP- cells co-express Nkx2.1, E-Cad and Spc, but not Fgf10. Note the absence of Fgf10 expression also in Epcam+ RFP+ cells. (F) Quantification of E-Cad+ RFP+ and Pro-Spc+ RFP+ cells from the staining shown in C,D. n=3. Scale bars: 50 μm (A,B); 25 μm (C,D).
Fig. 8.
Fig. 8.
The differentiation potential of Fgf10-positive cells varies throughout embryonic lung development. (A) Model showing the differentiation capacity of Fgf10-positive cells labeled at E11.5 or E15.5 and analyzed at E18.5. (B) Model showing that the Fgf10-expressing domain expands by de novo induction of Fgf10 expression.

References

    1. Barkauskas C. E., Cronce M. J., Rackley C. R., Bowie E. J., Keene D. R., Stripp B. R., Randell S. H., Noble P. W., Hogan B. L. M. (2013). Type 2 alveolar cells are stem cells in adult lung. J. Clin. Invest. 123, 3025–3036 - PMC - PubMed
    1. Bellusci S., Grindley J., Emoto H., Itoh N., Hogan B. L. (1997). Fibroblast growth factor 10 (FGF10) and branching morphogenesis in the embryonic mouse lung. Development 124, 4867–4878 - PubMed
    1. Boström H., Willetts K., Pekny M., Levéen P., Lindahl P., Hedstrand H., Pekna M., Hellström M., Gebre-Medhin S., Schalling M., et al. (1996). PDGF-A signaling is a critical event in lung alveolar myofibroblast development and alveogenesis. Cell 85, 863–873 - PubMed
    1. Chen L., Acciani T., Le Cras T., Lutzko C., Perl A.-K. T. (2012). Dynamic regulation of platelet-derived growth factor receptor α expression in alveolar fibroblasts during realveolarization. Am. J. Respir. Cell Mol. Biol. 47, 517–527 - PMC - PubMed
    1. Crapo J. D., Barry B. E., Gehr P., Bachofen M., Weibel E. R. (1982). Cell number and cell characteristics of the normal human lung. Am. Rev. Respir. Dis. 126, 332–337 - PubMed

Publication types

MeSH terms

Substances