. 2014 May 20;33(11):1914-27.
doi: 10.1002/sim.6077. Epub 2013 Dec 18.

Reclassification of predictions for uncovering subgroup specific improvement

Affiliations

Reclassification of predictions for uncovering subgroup specific improvement

Swati Biswas et al. Stat Med. .

Abstract

Risk prediction models play an important role in prevention and treatment of several diseases. Models that are in clinical use are often refined and improved. In many instances, the most efficient way to improve a successful model is to identify subgroups for which there is a specific biological rationale for improvement and tailor the improved model to individuals in these subgroups, an approach especially in line with personalized medicine. At present, we lack statistical tools to evaluate improvements targeted to specific subgroups. Here, we propose simple tools to fill this gap. First, we extend a recently proposed measure, the Integrated Discrimination Improvement, using a linear model with covariates representing the subgroups. Next, we develop graphical and numerical tools that compare reclassification of two models, focusing only on those subjects for whom the two models reclassify differently. We apply these approaches to BRCAPRO, a genetic risk prediction model for breast and ovarian cancer, using data from MD Anderson Cancer Center. We also conduct a simulation study to investigate properties of the new reclassification measure and compare it with currently used measures. Our results show that the proposed tools can successfully uncover subgroup specific model improvements.

Keywords: BRCAPRO; Integrated Discrimination Improvement; breast cancer; reclassification methods; risk prediction.


Figures

Figure 1
Figure 1
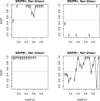
Proportion of correct reclassification (PCRc) comparing the “ER/PR, Her-2” model to the “ER/PR” model. The figures below each point are the total number of probands reclassified (nRc) at that cutoff. The gray vertical segments are 95% pointwise binomial CIs.
Figure 2
Figure 2
Proportion of correct reclassification (PCRc) comparing the “ER/PR, Her-2” model to the “ER/PR” model plotted for sub-groups of probands with specific combinations of ER/PR and Her-2/neu status. The figures below each point are the total number of probands reclassified (nRc) at that cutoff. When no reclassification occurs at a given cutoff, no point is plotted.
Figure 3
Figure 3
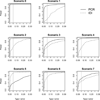
Power vs. Type I error in simulations: The parameters for various scenarios are listed in Table 4. The title of each plot corresponds to the scenario for power, while the type I error is for Scenario 9 in all plots. The light gray line is at type I error of 0.05. IDI: Integrated Discrimination Improvement; PCR: Proportion of Correct Reclassification.
Figure 4
Figure 4
Power vs. Type I error in simulations: The parameters for various scenarios are listed in Table 4. The title of each plot corresponds to the scenario for power, while the type I error is for Scenario 10 in all plots. The light gray line is at type I error of 0.05. IDI: Integrated Discrimination Improvement; PCR: Proportion of Correct Reclassification.
Figure 5
Figure 5
A sample of p’s and q’s generated under scenario 5. The orange and green pairs of lines (vertical and horizontal) are to facilitate seeing the total number of observations reclassified (nRc) at cutoffs of 0.2 and 0.7. Each pair of lines divides all points in four quadrants. The points in the second and fourth quadrant are the ones reclassified differently by the two models at that cutoff.

References

    1. Parmigiani G, Berry D, Aguilar O. Determining carrier probabilities for breast cancer- susceptibility genes BRCA1 and BRCA2. American Journal of Human Genetics. 1998;62:145–158. - PMC - PubMed
    1. Chen S, Wang W, Lee S, Nafa K, Lee J, Romans K, Watson P, Gruber SB, Euhus D, Kinzler KW, et al. Prediction of germline mutations and cancer risk in the Lynch syndrome. Journal of the American Medical Association. 2006;296:1479–1487. - PMC - PubMed
    1. D’Agostino RB, Vasan RS, Pencina MJ, Wolf PA, Cobain M, Massaro JM, Kannel WB. General cardiovascular risk profile for use in primary care: the Framingham Heart Study. Circulation. 2008;117:743–753. - PubMed
    1. Gail MH, Brinton LA, Byar DP, Corle DK, Green SB, Schairer C, Mulvihill JJ. Projecting individualized probabilities of developing breast cancer for white females who are being examined annually. Journal of the National Cancer Institute. 1989;81:1879–1886. - PubMed
    1. Meigs JB, Shrader P, Sullivan LM, McAteer JB, Fox CS, Dupuis J, Manning AK, Florez JC, Wilson PW, D’Agostino RB, et al. Genotype score in addition to common risk factors for prediction of type 2 diabetes. New England Journal of Medicine. 2008;359:2208–2219. - PMC - PubMed

Publication types

LinkOut - more resources