. 2013 Mar 1;7(3):205-209.
doi: 10.1038/nphoton.2012.336.

In vivo three-photon microscopy of subcortical structures within an intact mouse brain

Affiliations

In vivo three-photon microscopy of subcortical structures within an intact mouse brain

Nicholas G Horton et al. Nat Photonics. .

Abstract

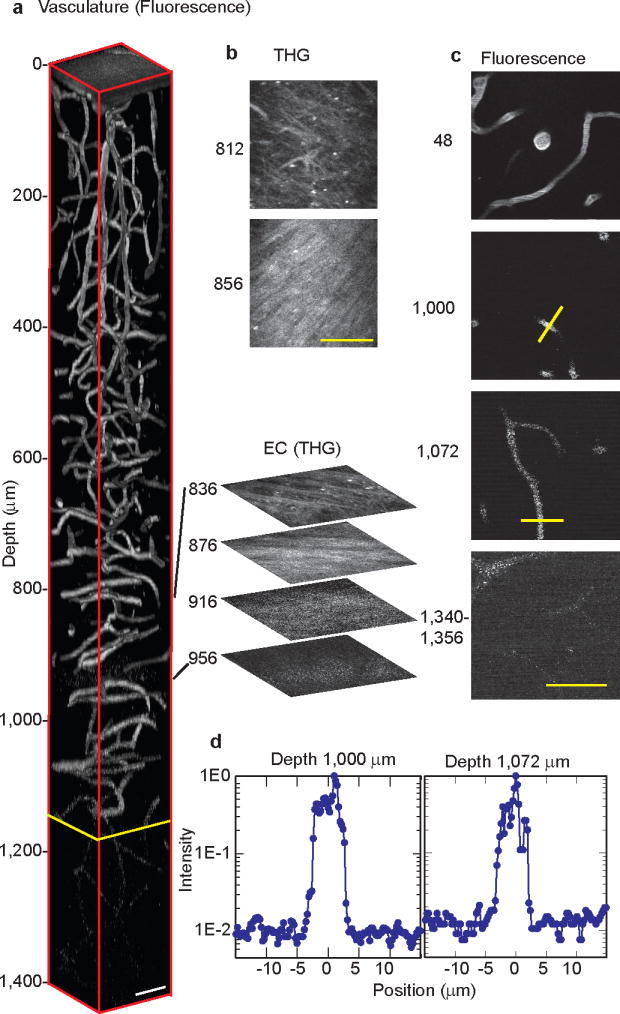
Two-photon fluorescence microscopy (2PM)1 enables scientists in various fields including neuroscience2,3, embryology4, and oncology5 to visualize in vivo and ex vivo tissue morphology and physiology at a cellular level deep within scattering tissue. However, tissue scattering limits the maximum imaging depth of 2PM within the mouse brain to the cortical layer, and imaging subcortical structures currently requires the removal of overlying brain tissue3 or the insertion of optical probes6,7. Here we demonstrate non-invasive, high resolution, in vivo imaging of subcortical structures within an intact mouse brain using three-photon fluorescence microscopy (3PM) at a spectral excitation window of 1,700 nm. Vascular structures as well as red fluorescent protein (RFP)-labeled neurons within the mouse hippocampus are imaged. The combination of the long excitation wavelength and the higher order nonlinear excitation overcomes the limitations of 2PM, enabling biological investigations to take place at greater depth within tissue.


Figures

Figure 1
Figure 1. Wavelength-dependent attenuation length in brain tissue and measured laser characteristics
a, Attenuation spectrum of a tissue model based on Mie scattering and water absorption, showing the absorption length of water (blue dash line), the scattering length of mouse brain cortex (red dash-dot line), and the combined effective attenuation length (green solid line). The scattering length is calculated using Mie theory for a tissue-like phantom solution containing 1 μm diameter polystyrene beads at a concentration of 5.4×10⁹/ml, which resembles the scattering property of the cortex (i.e., grey matter). The red stars indicate the reported attenuation lengths for mouse cortex in vivo from previous work. b, c, The measured second-order interferometric autocorrelation trace (b) and the corresponding spectrum (c) of the 1,675-nm soliton generated in the PC rod. The soliton energy, integrated from 1,617 nm, is 67 nJ.
Figure 2
Figure 2. In vivo 3PM images of Texas-red-dextran labeled mouse brain vasculature
a, 3D reconstruction of 3PM images of the brain of an FVB/N mouse. The EC extends from approximately 840 to 956 μm below the surface of the brain. Frames deeper than 1,136 μm (yellow line) were normalized to the frame at 1,136 μm; all other frames were individually normalized. The expanded optical sections to the right are representative THG images from the EC region of the brain. b, c, d, Normalized x-y frames of the THG (b) and fluorescence signal (c) at various depths. The bottom frame in (c) is a z projection of 20 μm. The fluorescence profiles of the lines across the vessels in (c) are displayed in semi-logarithmic plots (d), which are used for the SBR calculation. Background is calculated by averaging the intensity values between −15 and −5 μm and between 5 and 15 μm. All scale bars are 50 μm.
Figure 3
Figure 3. In vivo 3PM images of RFP-labeled neurons in mouse brain
a, 3D reconstruction of 3PM images in the brain of a B6.Cg-Tg(Thy1-Brainbow1.0)HLich/J mouse, which contains RFP-labelled pyramidal neurons. Frames deeper than 992 μm (yellow line) were normalized to the frame at 1,076 μm (i.e., the SP); all other frames were individually normalized. The expanded optical sections to the right are representative fluorescence images of the SP. The EC extends from approximately 840 to 976 μm below the surface of the brain, and the SP extends from approximately 1,060 to 1,120 μm below the surface. The scale bar is 50 μm. b, Epifluorescence image of the coronal section of the mouse brain at approximately the same location to that shown in (a). The white arrow indicates the SP. The scale bar is 250 μm. c, d, Normalized x-y frames of the fluorescence (c) and THG (d) signal at various depths. The scale bar is 50 μm.
Figure 4
Figure 4. Fluorescence signal attenuation curves of in vivo experiments
a, b, Semi-logarithmic plots of the fluorescence signal of the images in Fig. 2a (a) and Fig. 3a (b), normalized to the cubic of the laser power versus depth.
Figure 5
Figure 5. Resolution characterization of the 3PM
Intensity line profiles are used to characterize the lateral resolution. a, b, Sample x-y frames at 644 μm (a) and 844μm depth (b) of the B6.Cg-Tg(Thy1-Brainbow1.0)HLich/J mouse, where a line profile on the right is taken across a labelled neural process (indicated by yellow arrows). The scale bar is 50 μm. c, d, Axial measurements of FVB/n mouse Texas-red stained capillary vessels at 852 μm (c) and 948 μm (d) depth.

References

    1. Denk W, Strickler JH, Webb WW. Two-photon laser scanning fluorescence microscopy. Science. 1990;248:73–76. - PubMed
    1. Kerr JND, Denk W. Imaging in vivo: watching the brain in action. Nat Rev Neurosci. 2008;9:195–205. - PubMed
    1. Dombeck DA, Harvey CD, Tian L, Looger LL, Tank DW. Functional imaging of hippocampal place cells at cellular resolution during virtual navigation. Nat Neurosci. 2010;13:1433–1440. - PMC - PubMed
    1. Olivier N, et al. Cell lineage reconstruction of early zebrafish embryos using label-free nonlinear microscopy. Science. 2010;329:967–971. - PubMed
    1. Williams RM, et al. Strategies for high-resolution imaging of epithelial ovarian cancer by laparascopic nonlinear microscopy. Transl Oncol. 2010;3:181–194. - PMC - PubMed