

Real-time monitoring of membrane-protein reconstitution by isothermal titration calorimetry
- PMID: 24354292
- PMCID: PMC3886389
- DOI: 10.1021/ac403723t
Real-time monitoring of membrane-protein reconstitution by isothermal titration calorimetry
Abstract
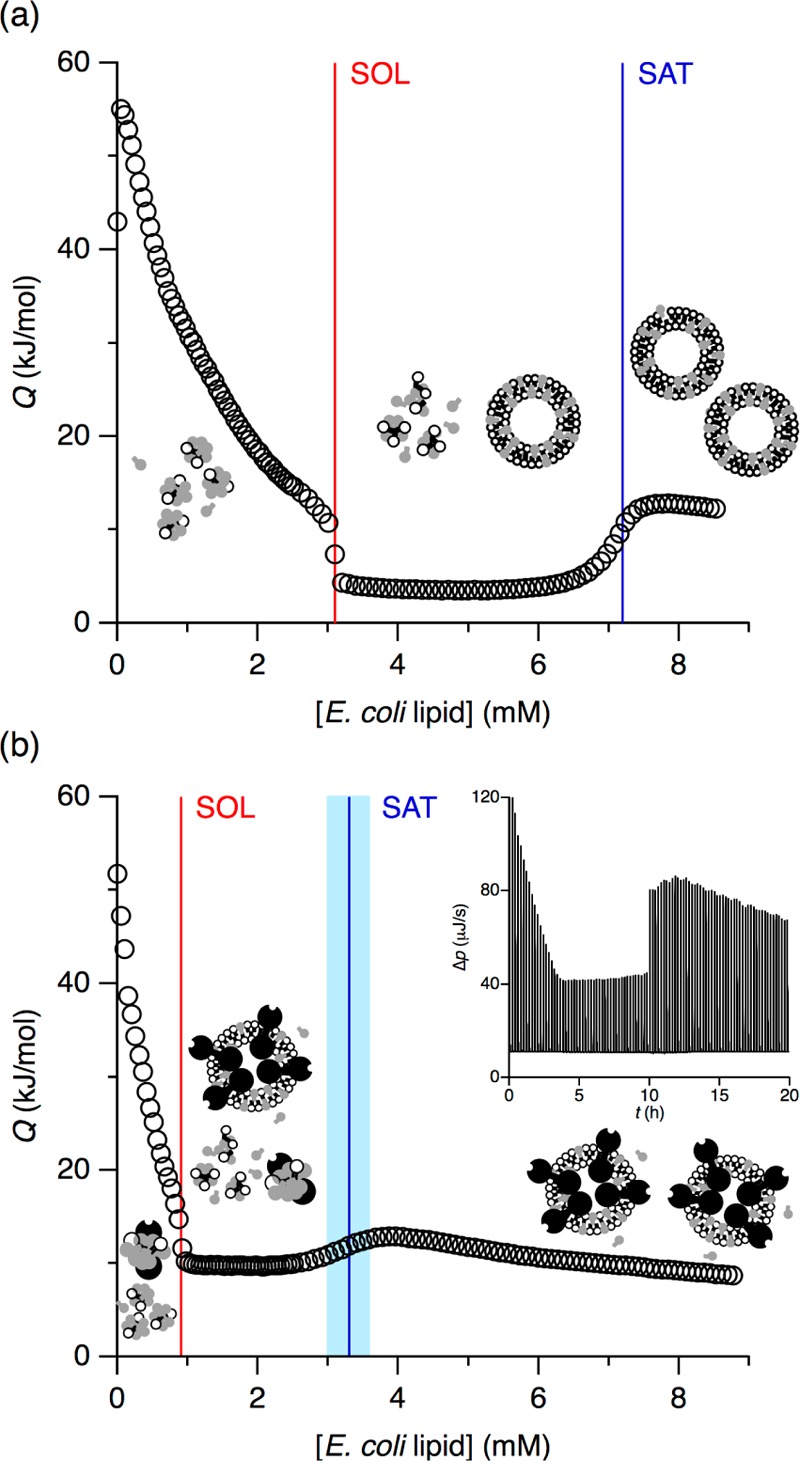
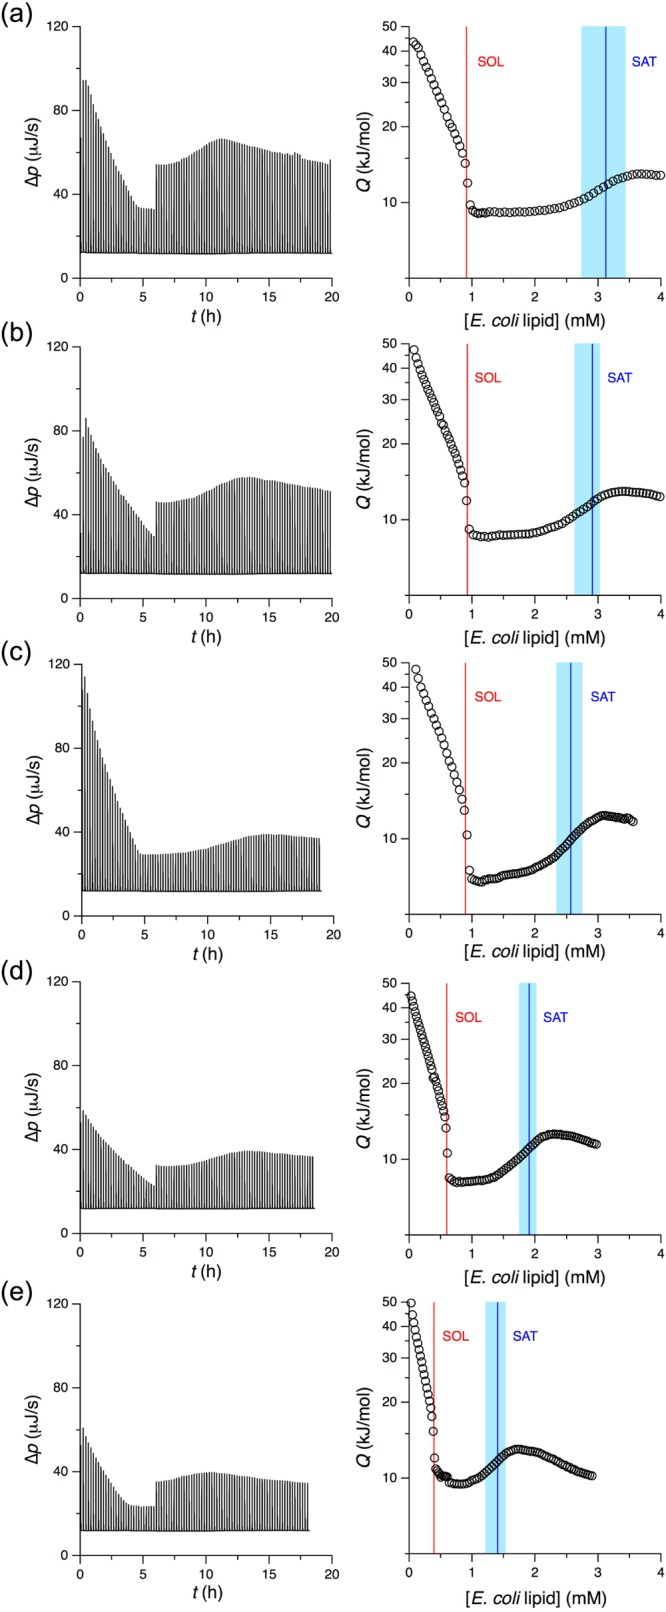
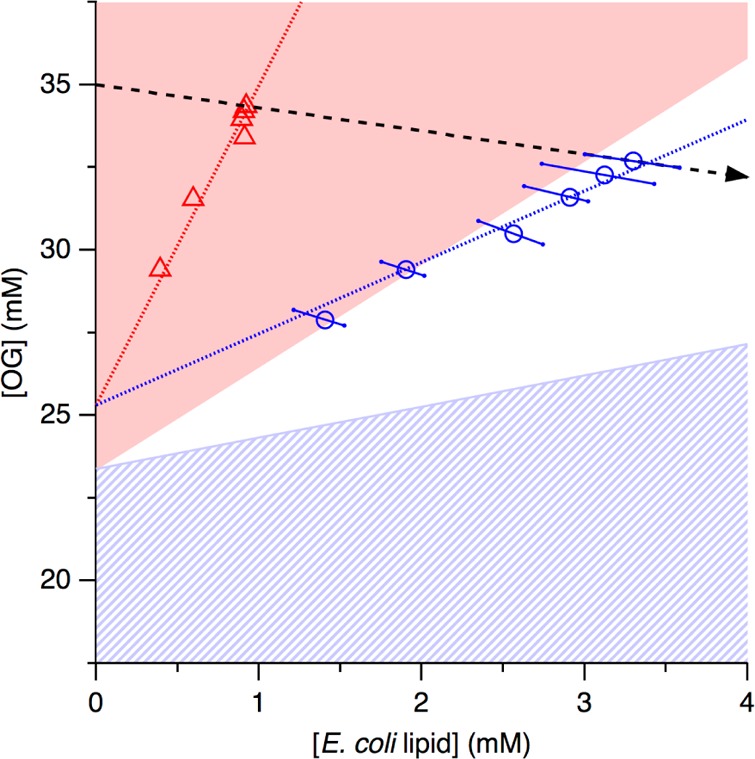
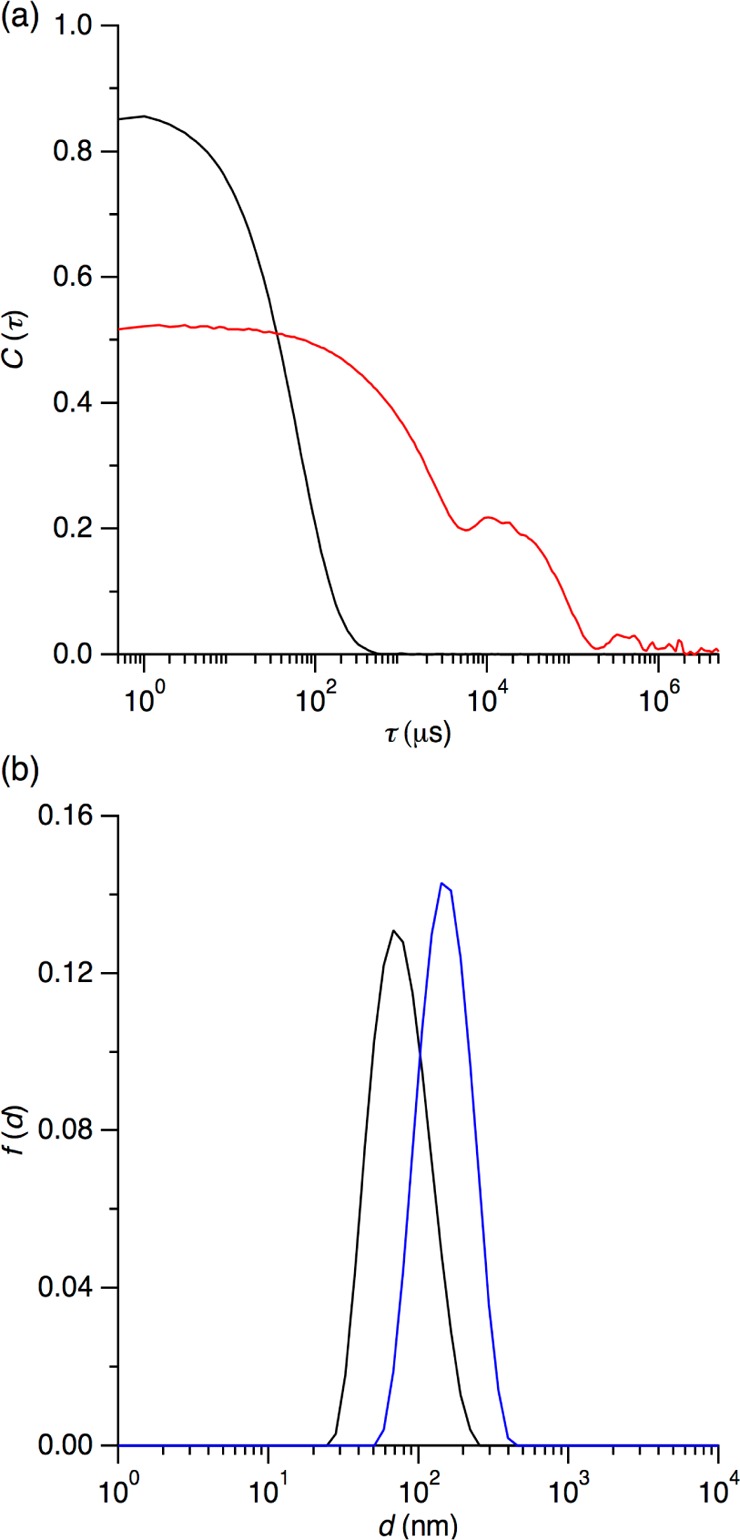
Phase diagrams offer a wealth of thermodynamic information on aqueous mixtures of bilayer-forming lipids and micelle-forming detergents, providing a straightforward means of monitoring and adjusting the supramolecular state of such systems. However, equilibrium phase diagrams are of very limited use for the reconstitution of membrane proteins because of the occurrence of irreversible, unproductive processes such as aggregation and precipitation that compete with productive reconstitution. Here, we exemplify this by dissecting the effects of the K(+) channel KcsA on the process of bilayer self-assembly in a mixture of Escherichia coli polar lipid extract and the nonionic detergent octyl-β-d-glucopyranoside. Even at starting concentrations in the low micromolar range, KcsA has a tremendous impact on the supramolecular organization of the system, shifting the critical lipid/detergent ratios at the onset and completion of vesicle formation by more than 2-fold. Thus, equilibrium phase diagrams obtained for protein-free lipid/detergent mixtures would be misleading when used to guide the reconstitution process. To address this issue, we demonstrate that, even under such nonequilibrium conditions, high-sensitivity isothermal titration calorimetry can be exploited to monitor the progress of membrane-protein reconstitution in real time, in a noninvasive manner, and at high resolution to yield functional proteoliposomes with a narrow size distribution for further downstream applications.
Figures
Similar articles
-
Calorimetric quantification of linked equilibria in cyclodextrin/lipid/detergent mixtures for membrane-protein reconstitution.Methods. 2015 Apr;76:183-193. doi: 10.1016/j.ymeth.2015.01.002. Epub 2015 Jan 10. Methods. 2015. PMID: 25583305
-
Membrane solubilisation and reconstitution by octylglucoside: comparison of synthetic lipid and natural lipid extract by isothermal titration calorimetry.Biophys Chem. 2010 Aug;150(1-3):105-11. doi: 10.1016/j.bpc.2010.03.013. Epub 2010 Mar 20. Biophys Chem. 2010. PMID: 20392557
-
Calorimetric Quantification of Cyclodextrin-Mediated Detergent Extraction for Membrane-Protein Reconstitution.Methods Enzymol. 2016;567:129-56. doi: 10.1016/bs.mie.2015.07.033. Epub 2015 Sep 15. Methods Enzymol. 2016. PMID: 26794353
-
Titration calorimetry of surfactant-membrane partitioning and membrane solubilization.Biochim Biophys Acta. 2000 Nov 23;1508(1-2):69-85. doi: 10.1016/s0304-4157(00)00009-5. Biochim Biophys Acta. 2000. PMID: 11090819 Review.
-
Vesicle reconstitution from lipid-detergent mixed micelles.Biochim Biophys Acta. 2000 Nov 23;1508(1-2):34-50. doi: 10.1016/s0304-4157(00)00006-x. Biochim Biophys Acta. 2000. PMID: 11090817 Review.
Cited by
-
Real time monitoring of membrane GPCR reconstitution by plasmon waveguide resonance: on the role of lipids.Sci Rep. 2016 Nov 8;6:36181. doi: 10.1038/srep36181. Sci Rep. 2016. PMID: 27824122 Free PMC article.
-
Biomimetic Materials to Fabricate Artificial Cells.Chem Rev. 2024 Dec 11;124(23):13178-13215. doi: 10.1021/acs.chemrev.4c00241. Epub 2024 Nov 26. Chem Rev. 2024. PMID: 39591535 Free PMC article. Review.
-
Extending the Pseudo-Phase Model of Detergent-Lipid Dispersions by a Detergent-Binding Protein.Langmuir. 2022 Dec 20;38(50):15592-15603. doi: 10.1021/acs.langmuir.2c02234. Epub 2022 Dec 8. Langmuir. 2022. PMID: 36480936 Free PMC article.
-
Isothermal titration calorimetry of ion-coupled membrane transporters.Methods. 2015 Apr;76:171-182. doi: 10.1016/j.ymeth.2015.01.012. Epub 2015 Feb 9. Methods. 2015. PMID: 25676707 Free PMC article.
-
Single-file transport of water through membrane channels.Faraday Discuss. 2018 Sep 28;209(0):9-33. doi: 10.1039/c8fd00122g. Faraday Discuss. 2018. PMID: 30014085 Free PMC article.
References
-
- Overington J. P.; Al Lazikani B.; Hopkins A. L. Nat. Rev. Drug Discovery 2006, 5, 993–996. - PubMed
-
- le Maire M.; Champeil P.; Møller J. V. Biochim. Biophys. Acta 2000, 1508, 86–111. - PubMed
-
- Privé G. G. Methods 2007, 41, 388–397. - PubMed
-
- Duquesne K.; Sturgis J. N. Methods Mol. Biol. 2010, 601, 205–217. - PubMed
-
- Saparov S. M.; Kozono D.; Rothe U.; Agre P.; Pohl P. J. Biol. Chem. 2001, 276, 31515–31520. - PubMed
Publication types
MeSH terms
Substances
Grants and funding
LinkOut - more resources
Full Text Sources
Other Literature Sources
