. 2014 Feb;104 Suppl 1(Suppl 1):S175-82.
doi: 10.2105/AJPH.2013.301509. Epub 2013 Dec 19.

Association between birthplace and current asthma: the role of environment and acculturation

Affiliations

Association between birthplace and current asthma: the role of environment and acculturation

Shahed Iqbal et al. Am J Public Health. 2014 Feb.

Abstract

Objectives: We evaluated associations between current asthma and birthplace among major racial/ethnic groups in the United States.

Methods: We used multivariate logistic regression methods to analyze data on 102,524 children and adolescents and 255,156 adults in the National Health Interview Survey (2001-2009).

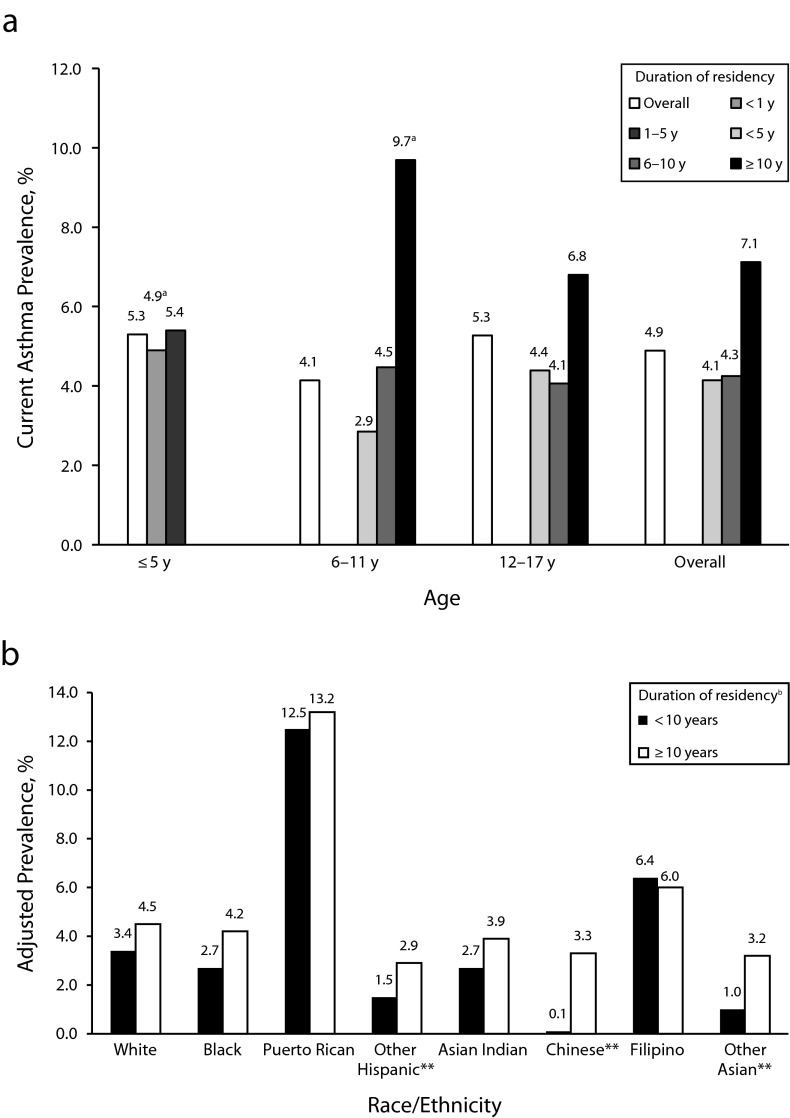
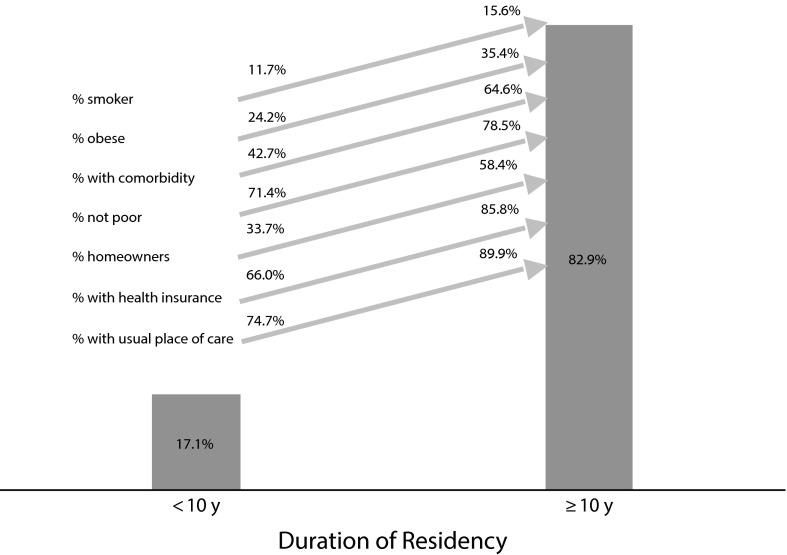
Results: We found significantly higher prevalence (P < .05) of current asthma among children and adolescents (9.3% vs 5.1%) and adults (7.6% vs 4.7%) born in the 50 states and Washington, DC (US-born), than among those born elsewhere. These differences were among all age groups of non-Hispanic Whites, non-Hispanic Blacks, and Hispanics (excluding Puerto Ricans) and among Chinese adults. Non-US-born adults with 10 or more years of residency in the United States had higher odds of current asthma (odds ratio = 1.55; 95% confidence interval = 1.25, 1.93) than did those who arrived more recently. Findings suggested a similar trend among non-US-born children.

Conclusions: Current asthma status was positively associated with being born in the United States and with duration of residency in the United States. Among other contributing factors, changes in environment and acculturation may explain some of the differences in asthma prevalence.


Figures

FIGURE 1—
FIGURE 1—
Adjusted current asthma prevalence by race/ethnicity among US-born and non–US-born (a) children and adolescents (aged < 18 years) and (b) adults (aged ≥ 18 years): National Health Interview Survey, United States, 2001–2009. Note. US-born = born in the 50 US states or Washington, DC. For children and adolescents, multivariate model adjusted for age, gender, poverty level, home ownership status of primary caregiver, low birth weight, region of residence, and birthplace, averaged over significant 2-way interactions between all variables in the model (other race category not included in the figure). For adults, multivariate model adjusted for age, gender, education level, poverty level, home ownership status, smoking status, body mass index, health insurance coverage, having a usual place of medical care, comorbidities, region of residence, and birthplace, averaged over significant 2-way interactions between birthplace, race/ethnicity and other variables. American Indian/Alaska Native and other race categories not included in the figure. The overall adjusted prevalence was (a) 9.3% for US-born and 5.1% for non–US-born (P < .001) and (b) 7.6% for US-born and 4.7% for non–US-born (P < .001) aStatistically unreliable (unweighted n < 20). *P < .05.
FIGURE 2—
FIGURE 2—
Current asthma prevalence among non–US-born (a) children and adolescents (aged < 18 years) by age and duration of US residency and (b) adults (aged ≥ 18 years) by race/ethnicity and duration of US residency: National Health Interview Survey, United States, 2001–2009. Note. US-born = born in the 50 US states or Washington, DC. For adults, multivariate model adjusted for age, gender, poverty level, home ownership status, smoking status, body mass index, health insurance coverage, having a usual place of medical care, comorbidities, and region of residence. American Indian/Alaska Native and other race categories not included in the figure. aMight be statistically inconsistent because of small sample size in the stratum. bFor ≥ 10 years vs < 10 years residency, adjusted odds ratio = 1.55 (95% confidence interval = 1.25, 1.93). **P < .001.
FIGURE 3—
FIGURE 3—
Distribution of current asthma prevalence among non–US-born adults and changes in individual and sociodemographic factors with duration of US residency: National Health Interview Survey, United States, 2001–2009. Note. US-born = born in the 50 US states or Washington, DC.

Similar articles

Cited by

References

    1. Braman SS. The global burden of asthma. Chest. 2006;130(1 suppl):4S–12S. - PubMed
    1. Mannino DM, Homa DM, Akinbami LJ, Moorman JE, Gwynn C, Redd SC. Surveillance for asthma—United States, 1980–1999. MMWR Surveill Summ. 2002;51(1):1–13. - PubMed
    1. Centers for Disease Control and Prevention. Vital signs: asthma prevalence, disease characteristics, and self-management education—United States, 2001–2009. MMWR Morb Mortal Wkly Rep. 2011;60(17):547–552. - PubMed
    1. Holguin F, Mannino DM, Antó J et al. Country of birth as a risk factor for asthma among Mexican Americans. Am J Respir Crit Care Med. 2005;171(2):103–108. - PubMed
    1. Sundquist J, Winkleby MA. Country of birth, acculturation status and abdominal obesity in a national sample of Mexican-American women and men. Int J Epidemiol. 2000;29(3):470–477. - PubMed