

Shifts in intended and unintended pregnancies in the United States, 2001-2008
- PMID: 24354819
- PMCID: PMC4011100
- DOI: 10.2105/AJPH.2013.301416
Shifts in intended and unintended pregnancies in the United States, 2001-2008
Abstract
Objectives: We monitored trends in pregnancy by intendedness and outcomes of unintended pregnancies nationally and for key subgroups between 2001 and 2008.
Methods: Data on pregnancy intentions from the National Survey of Family Growth (NSFG) and a nationally representative survey of abortion patients were combined with counts of births (from the National Center for Health Statistics), counts of abortions (from a census of abortion providers), estimates of miscarriages (from the NSFG), and population denominators from the US Census Bureau to obtain pregnancy rates by intendedness.
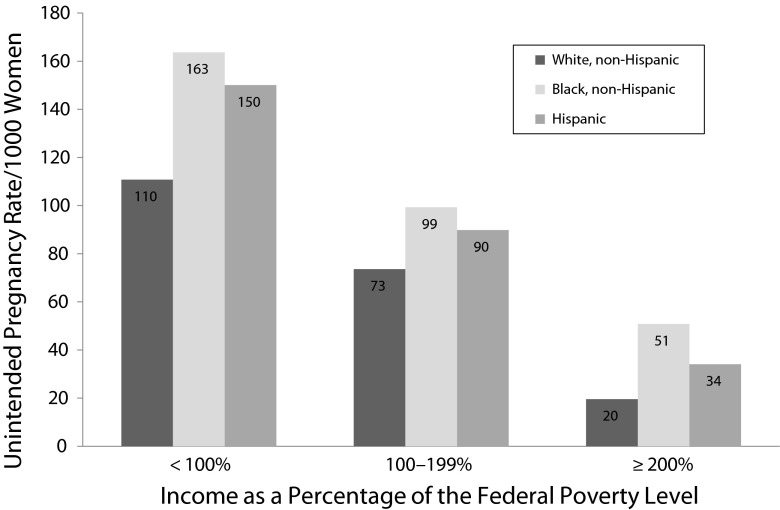
Results: In 2008, 51% of pregnancies in the United States were unintended, and the unintended pregnancy rate was 54 per 1000 women ages 15 to 44 years. Between 2001 and 2008, intended pregnancies decreased and unintended pregnancies increased, a shift previously unobserved. Large disparities in unintended pregnancy by relationship status, income, and education increased; the percentage of unintended pregnancies ending in abortion decreased; and the rate of unintended pregnancies ending in birth increased, reaching 27 per 1000 women.
Conclusions: Reducing unintended pregnancy likely requires addressing fundamental socioeconomic inequities, as well as increasing contraceptive use and the uptake of highly effective methods.
Figures
References
-
- US Department of Health and Human Services. Washington, DC: US Department of Health and Human Services; 2010. Healthy People 2020 topics and objectives. Available at: http://www.healthypeople.gov/2020/topicsobjectives2020/objectiveslist.as.... Accessed August 10, 2012.
-
- Guttmacher Institute. A Real-Time Look at the Impact of the Recession on Women’s Family Planning and Pregnancy Decisions. New York, NY: Guttmacher Institute; 2009.
-
- Gold RB. Recession taking its toll: family planning safety net stretched thin as service demand increases. Guttmacher Policy Rev. 2010;13(1):8–12.
Publication types
MeSH terms
Grants and funding
LinkOut - more resources
Full Text Sources
Other Literature Sources
Medical
