. 2013 Dec;26(6):699-719.
doi: 10.1177/197140091302600614. Epub 2013 Dec 18.

MRI of the brachial plexus: modified imaging technique leading to a better characterization of its anatomy and pathology

Affiliations

MRI of the brachial plexus: modified imaging technique leading to a better characterization of its anatomy and pathology

Carlos Torres et al. Neuroradiol J. 2013 Dec.

Abstract

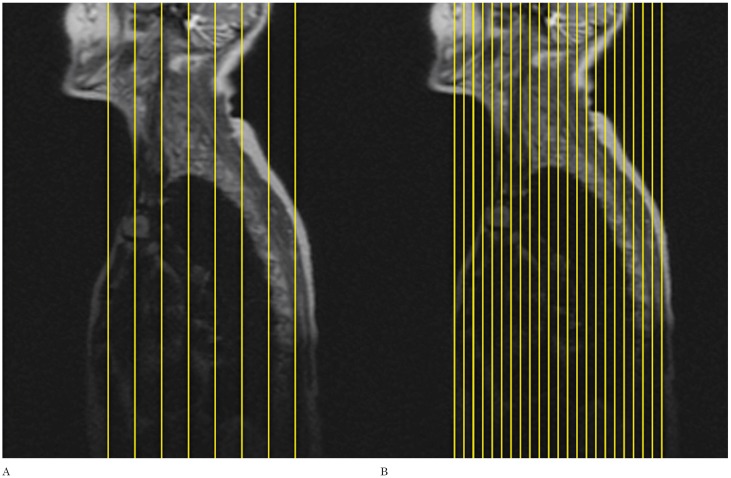
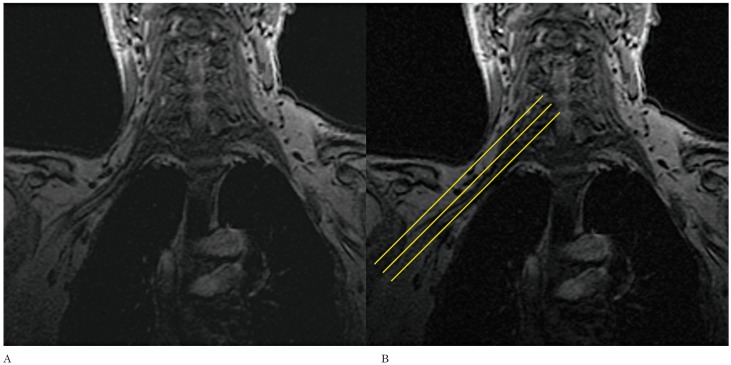
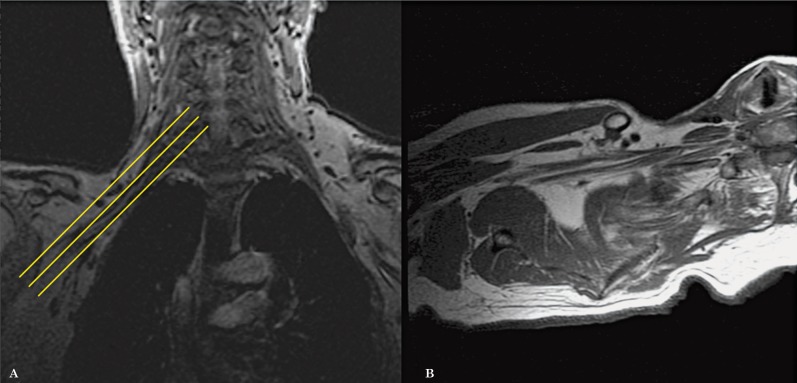
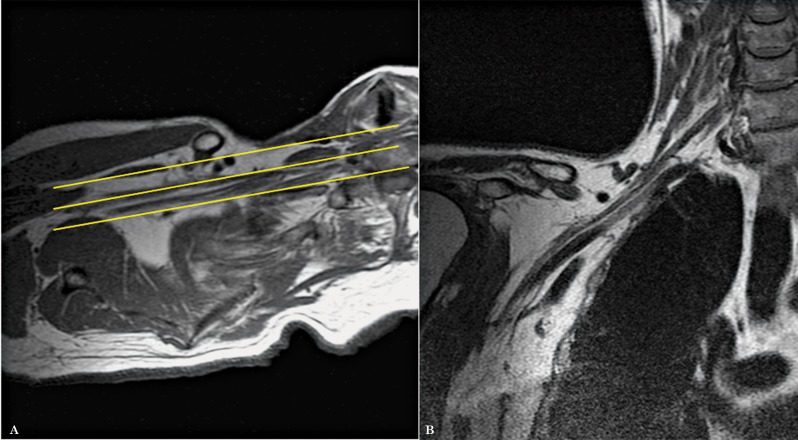
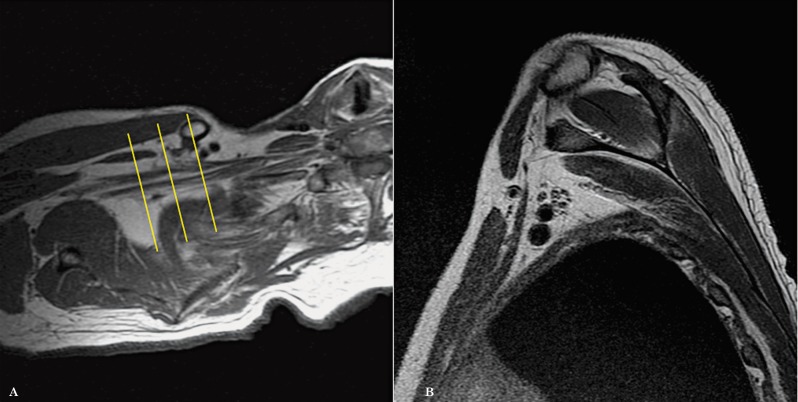
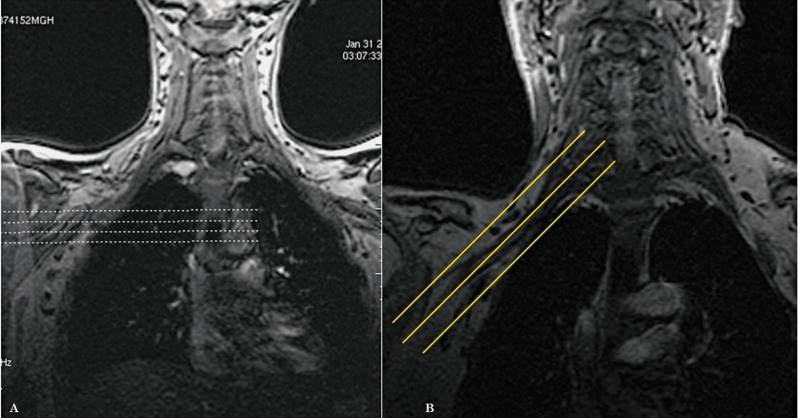
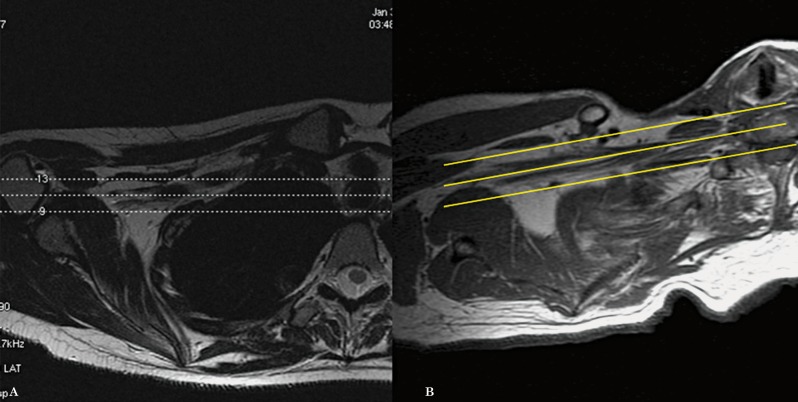
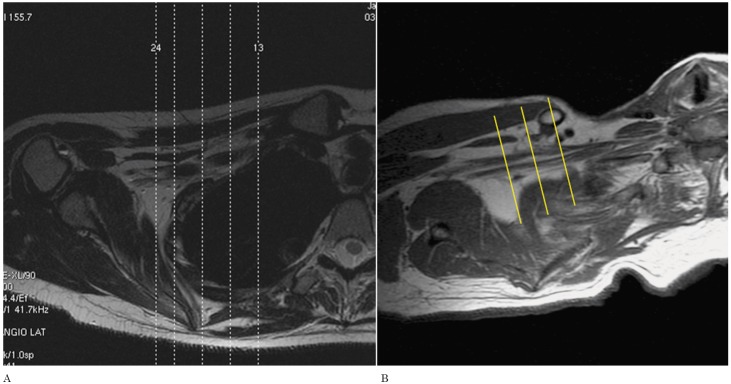
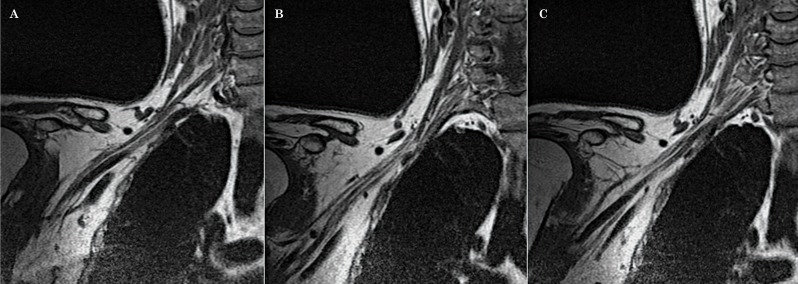
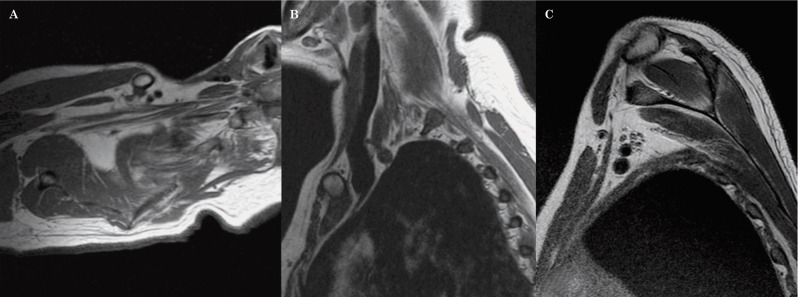
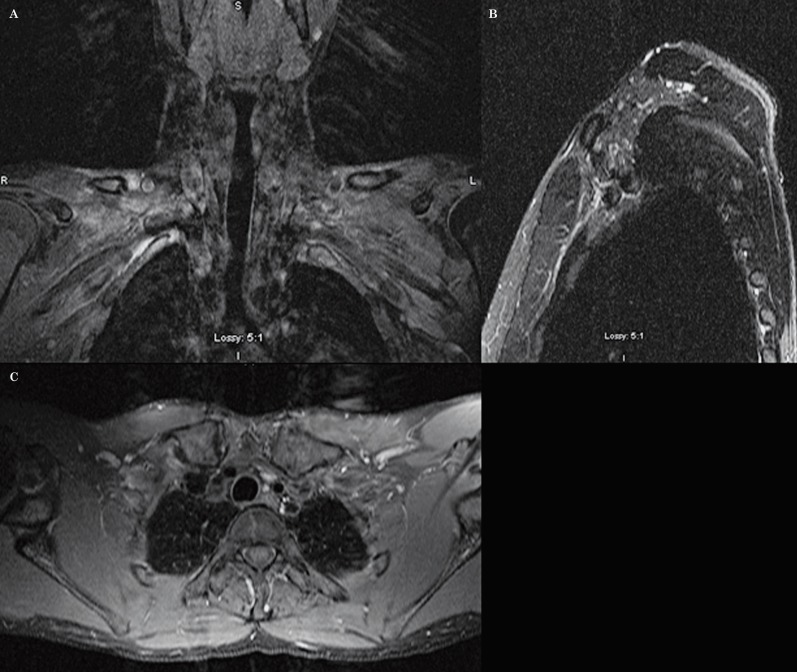
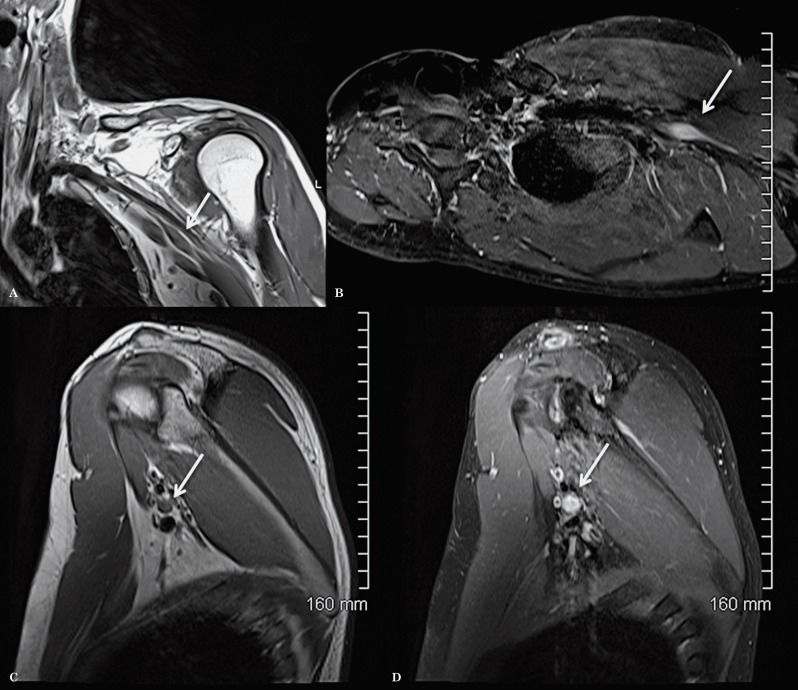
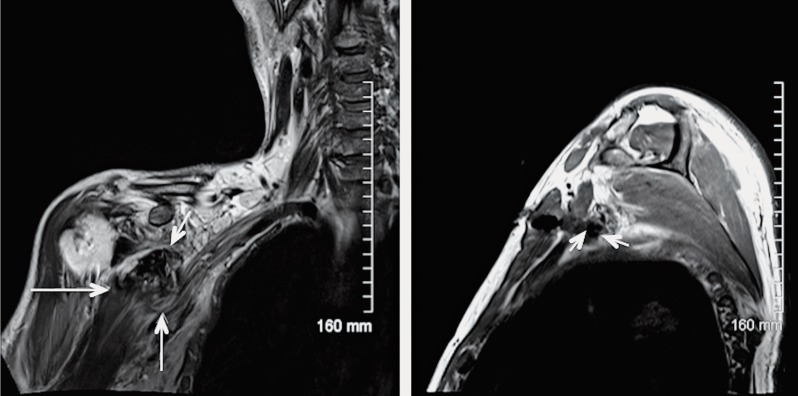
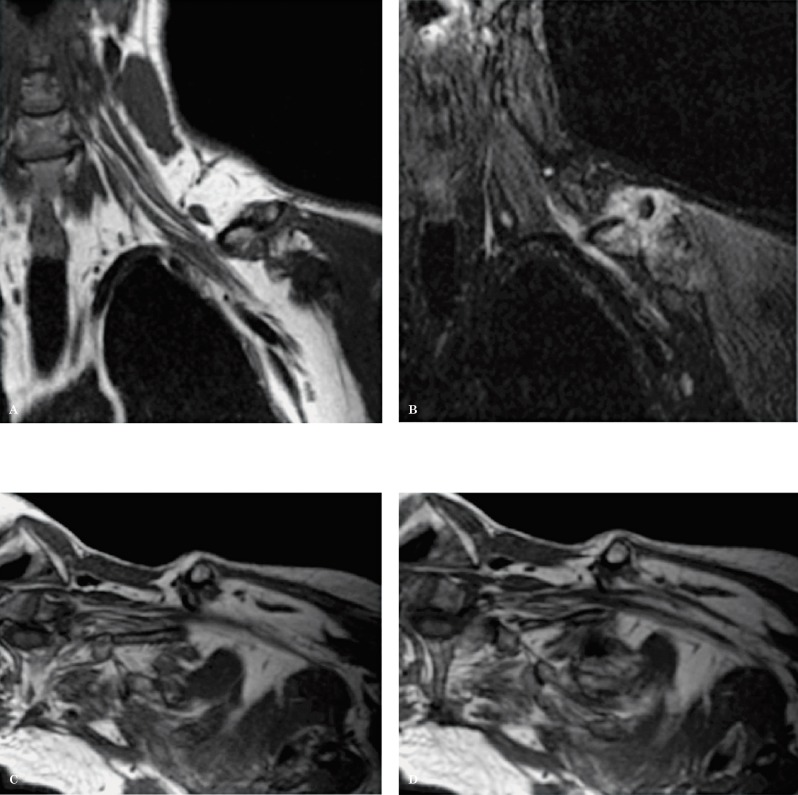
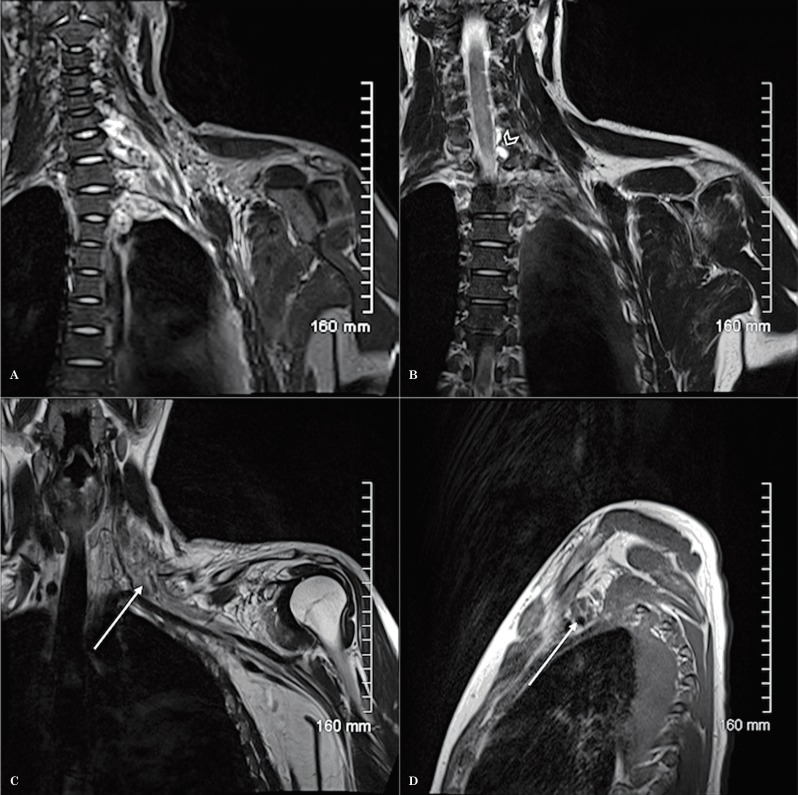
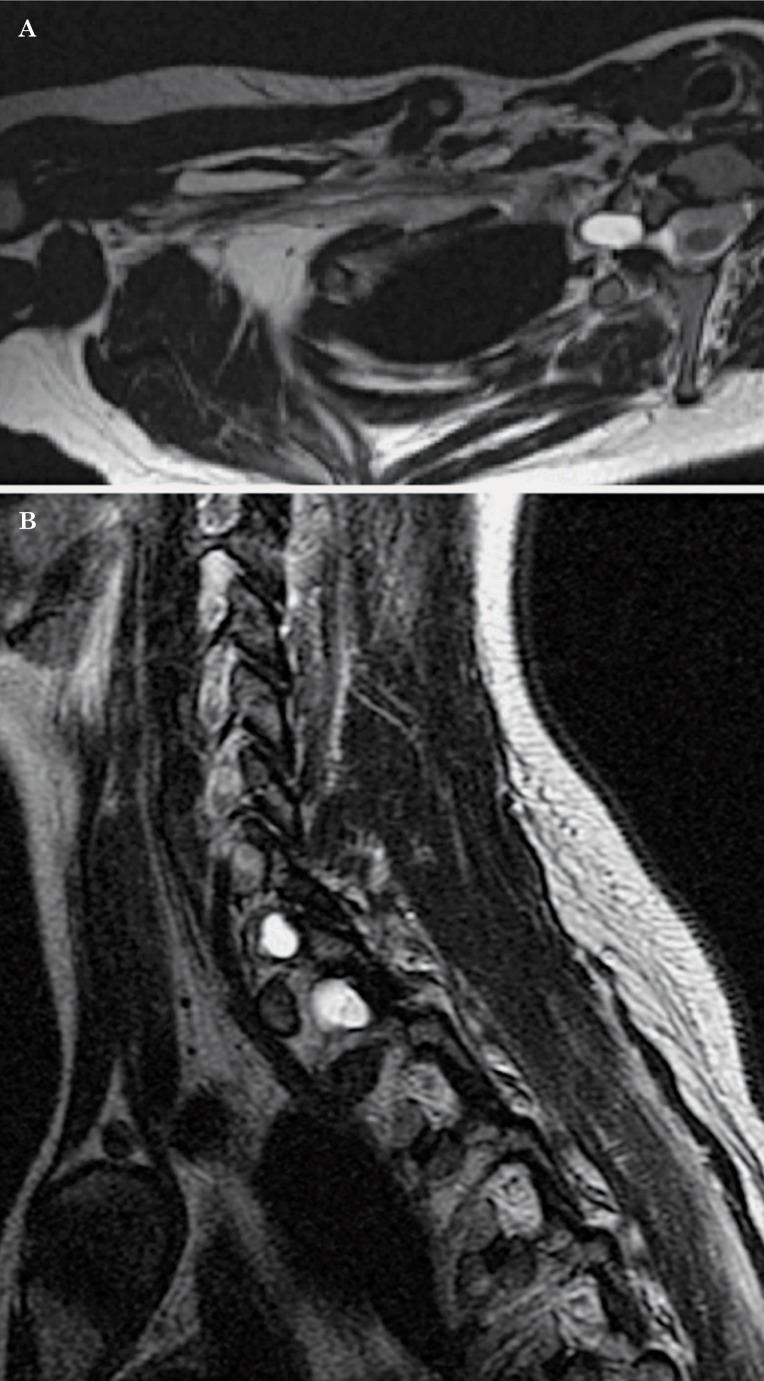
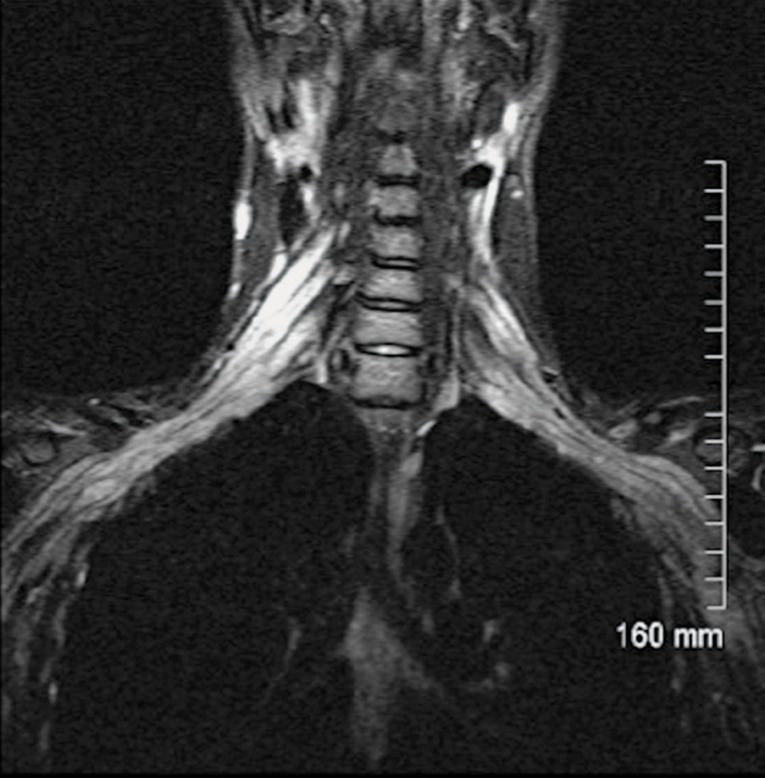
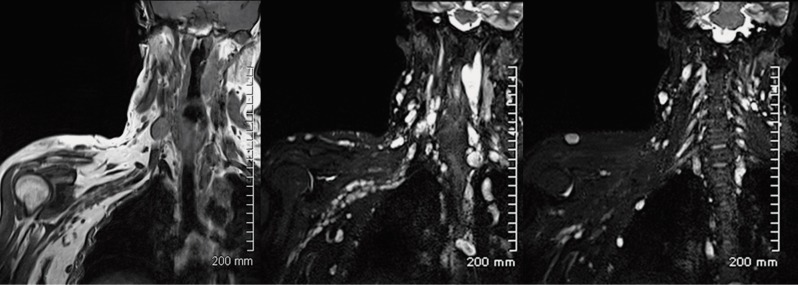
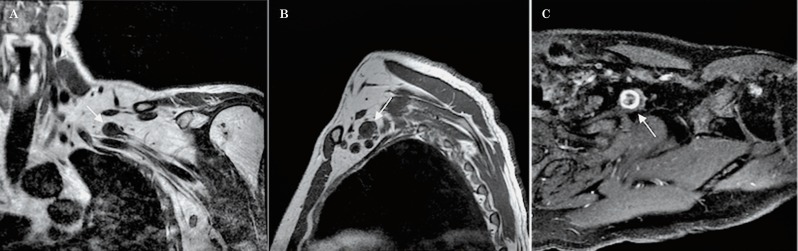
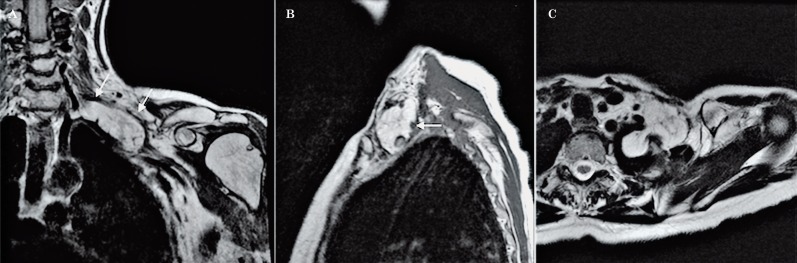
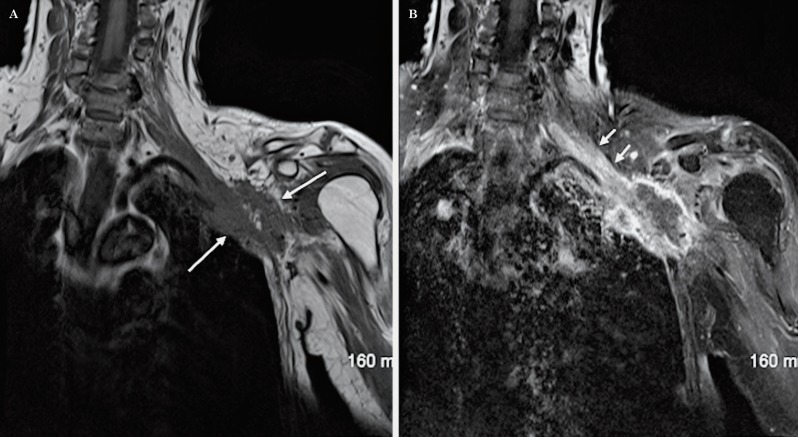
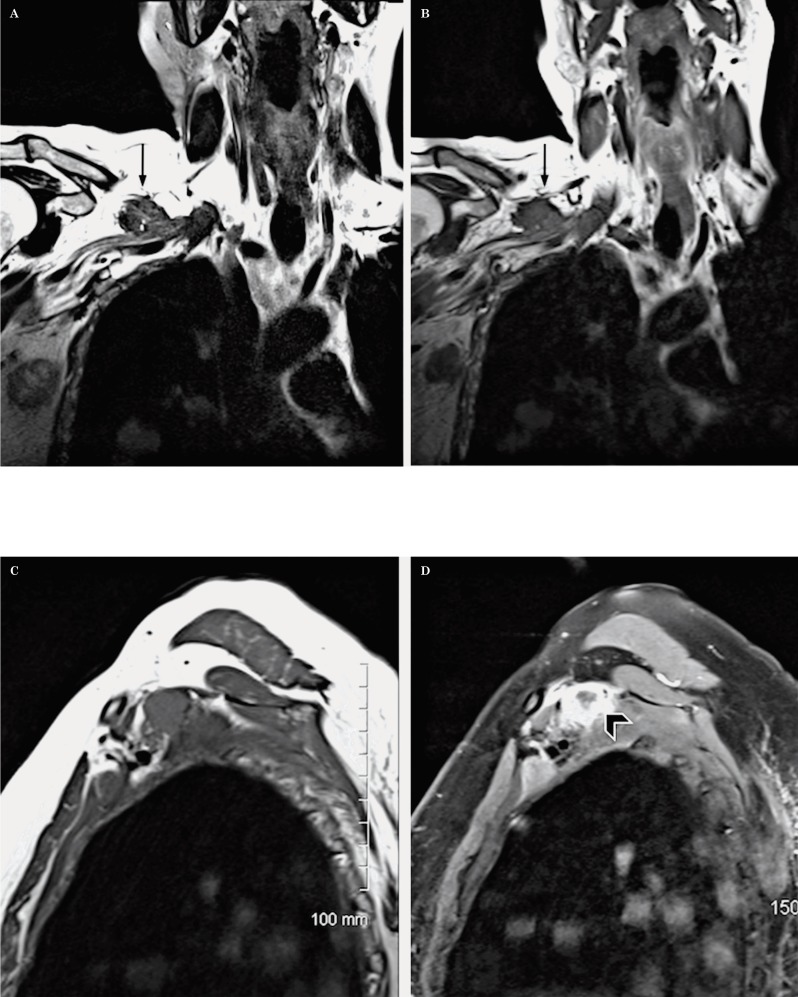
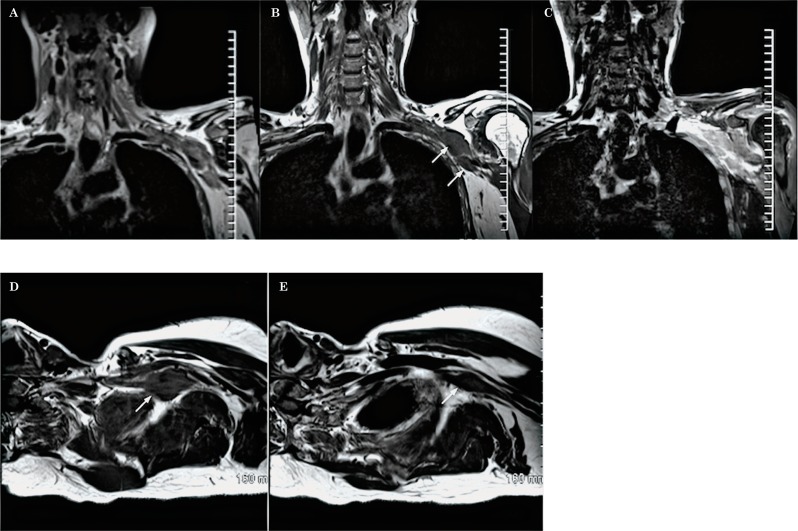
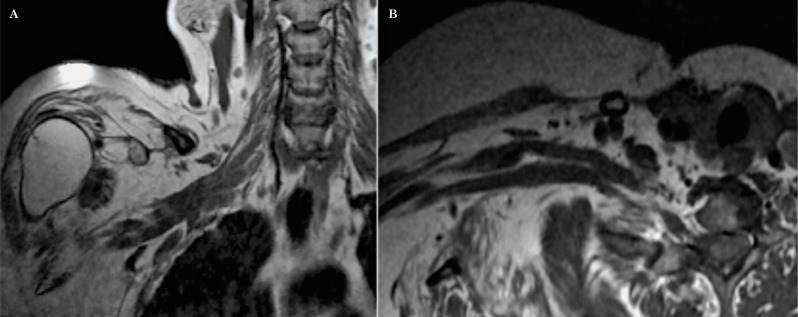
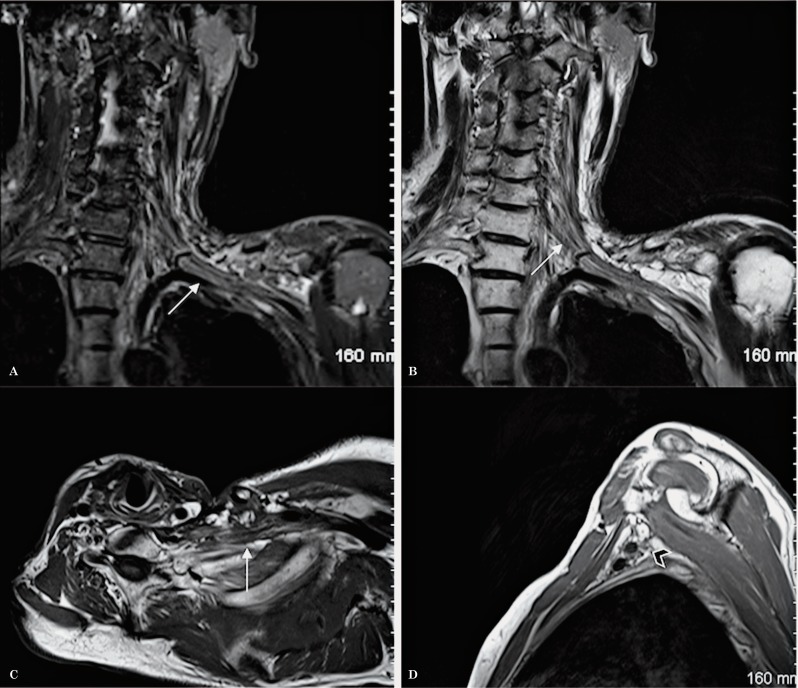
Magnetic resonance imaging (MRI) is the imaging modality of choice for the evaluation of the brachial plexus due to its superior soft tissue resolution and multiplanar capabilities. The evaluation of the brachial plexus however represents a diagnostic challenge for the clinician and the radiologist. The imaging assessment of the brachial plexus, in particular, has been traditionally challenging due to the complexity of its anatomy, its distribution in space and due to technical factors. Herein, we describe a modified technique used in our institution for the evaluation of the brachial plexus which led to a substantial decrease in scanning time and to better visualization of all the segments of the brachial plexus from the roots to the branches, in only one or two images, facilitating therefore the understanding of the anatomy and the interpretation of the study. To our knowledge, we are the first group to describe this technique of imaging the brachial plexus. We illustrate the benefit of this modified technique with an example of a patient with a lesion in the proximal branches of the left brachial plexus that was clinically suspected but missed on conventional brachial plexus imaging for six consecutive years. In addition, we review the common and infrequent benign and malignant pathology that can affect the brachial plexus.

Keywords: anatomy; brachial plexus; diagnosis; magnetic resonance imaging; modified technique; pathology.


Figures

Figure 1
Figure 1
The number of slices in the localizer sequence has been increased to improve visualization of the nerve roots. Conventional localizer (A), modified localizer (B).
Figure 2
Figure 2
Note the improved visualization of the right brachial plexus (A) in the coronal localizer which enables the axial oblique images to be planned angling parallel to the nerve roots (b).
Figure 3
Figure 3
Axial oblique images are planned from the coronal localizer in the planes of the trunks and divisions of the brachial plexus (A). The images obtained allow the roots, trunks, divisions and cords to be assessed in only 1 to 2 slices (B).
Figure 4
Figure 4
Coronal oblique images are planned from the axial oblique dataset, also following the plane of the proximal and mid segments of the brachial plexus (A). The images obtained demonstrate in a single slice, the roots, trunks, divisions and cords (B).
Figure 5
Figure 5
Sagittal oblique images are also planned from the axial oblique dataset, perpendicular to the mid segment of the brachial plexus (A,B).
Figure 6
Figure 6
Planning of axial images: Conventional technique (A) and Modified technique (B).
Figure 7
Figure 7
Planning of coronal images: Conventional technique (A) and Modified technique (B).
Figure 8
Figure 8
Planning of sagittal images: Conventional technique (A) and Modified technique (B).
Figure 9
Figure 9
Normal anatomy of the brachial plexus. Coronal oblique images allow the roots, trunks, divisions, cords and branches to be assessed in a continuous fashion in 1 to 3 slices (A-C).
Figure 10
Figure 10
Normal anatomy of the brachial plexus. A T1-weighted sequence in the axial oblique plane (A) shows the roots, the trunks and the divisions of the brachial plexus in a continuous fashion, surrounded by fat. Sagittal oblique T1-weighted images demonstrate the roots within the scalene triangle (B) and the cords in the axillary region (C).
Figure 11
Figure 11
MRI of the left brachial plexus using the Conventional technique, in 2005, for the study of ulnar neuropathy. Coronal T1-weighted sequence post-contrast with fat saturation (A), sagittal STIR (B) and axial T1-weighted sequence post-contrast with fat saturation (C). No abnormality was identified.
Figure 12
Figure 12
MRI of left brachial plexus using the modified technique, in 2011, as a follow up study for ulnar neuropathy. Coronal oblique T1 (A), axial oblique T1 post-contrast with fat saturation (B), sagittal T1 (C) and sagittal T1-weighted sequence post-contrast with fat saturation (D) show a focal well-defined enhancing mass lesion along the proximal branches of the left brachial plexus, likely consistent with a schwannoma.
Figure 13
Figure 13
Cartoon of the anatomy of the brachial plexus.
Figure 14
Figure 14
Normal anatomy. A coronal oblique T2W sequence shows the different segments of the brachial plexus. The roots (R) are located medial and within the scalene triangle; the middle scalene muscle (*) demarcates the lateral border of the scalene triangle. The trunks (T) are visualized at the lateral border of the scalene triangle, the divisions (D) between the first rib and the clavicle (curved arrow) and the cords (C) and the terminal branches (B) on both sides of the coracoid process of the scapula (^).
Figure 15
Figure 15
Normal anatomy. An axial oblique T2W sequence shows important anatomical landmarks. A) the anterior scalene muscle (*), the middle scalene muscle (^) and the clavicle (arrowhead) are identified. B) It is possible to appreciate how the roots (R) exit the neuroforamina and join within the scalene triangle to form the trunks (T). The divisions (D) are located behind the clavicle and become the cords (C) distally.
Figure 16
Figure 16
Normal anatomy. Sagittal T1W sequence of the brachial plexus. A) The image shows the 3 scalene muscles (A: anterior, M: middle, P: posterior) and the roots (arrowhead) within the scalene triangle. B) A more lateral image shows the anterosuperior position of the divisions (arrowhead) with respect to the first rib (curved arrow). The subclavian vein (o) is located anterior to the subclavian artery (*) at this level. C) At the level of the axilla and coracoid process (arrow), the proximal branches surround the subclavian artery (*) which is localized above the subclavian vein (o).
Figure 17
Figure 17
Coronal T2 (A) and sagittal T1W sequences (B) show a large post-traumatic hematoma (arrows) causing extrinsic compression on the divisions and cords of the right brachial plexus in a patient with penetrating injury with a knife.
Figure 18
Figure 18
Fracture of the left clavicle with prominent callus formation exerting mass effect on the divisions of the brachial plexus. Coronal oblique T1 (A), coronal oblique STIR (B) and axial oblique T1W sequences (C,D). Note the increased signal intensity of the divisions in the STIR sequence secondary to inflammatory changes.
Figure 19
Figure 19
Trauma. Coronal oblique T2 (A,B), coronal oblique T1 (C) and sagittal T1W sequences (D) demonstrate thickening and increased T2 signal of the plexus (A,B) secondary to edema (arrows). The brachial plexus is ill-defined and there is distortion and stranding of the surrounding fat due to inflammatory changes. Two post-traumatic pseudomeningoceles (B) are identified at the level of C6-C7 and C7-T1 (arrowhead).
Figure 20
Figure 20
Trauma. Axial oblique (A) and sagittal T2W sequences (B) in a different patient demonstrate post-traumatic pseudomeningoceles in 2 different levels. There are edematous changes in the trunks and divisions of the brachial plexus which are thickened and show increased signal intensity (A).
Figure 21
Figure 21
CIDP. Coronal STIR sequence shows symmetric thickening and increased signal intensity of the bilateral brachial plexus.
Figure 22
Figure 22
Multiple neurofibromas in a patient with Neurofibromatosis type 1. Coronal oblique T1 and coronal oblique STIR sequences show multiple ovoid masses along the right brachial plexus as well as in both paravertebral regions and in the subcutaneous tissues of the neck. These lesions are isointense to muscle in T1 and hyperintense in the STIR sequence.
Figure 23
Figure 23
Schwannoma. Coronal oblique T1 (A), sagittal T1 (B) and axial oblique T1W sequence post-contrast with fat saturation (C) show an ovoid mass (arrows), isointense to muscle in T1 with a peripheral “target sign” post-contrast enhancement involving the divisions of the left brachial plexus.
Figure 24
Figure 24
Lipoma. Coronal T1 (A), sagittal T1 (B) and axial T2W sequences (C) demonstrate a large lipoma within the scalene triangle with supraclavicular extension. The lipoma is splaying the roots and trunks (arrows) of the left brachial plexus.
Figure 25
Figure 25
Lung cancer (Pancoast’s tumor). Coronal oblique T1 (A) and coronal oblique T1W sequence post contrast with fat saturation (B) demonstrate a partially necrotic mass in the left lung apex, with peripheral enhancement (long arrows) which shows extension to the thoracic wall and invasion of the divisions and cords of the brachial plexus. In addition, there is malignant involvement of the proximal segment of the brachial plexus with thickening and post-contrast enhancement of the roots and trunks (short arrows).
Figure 26
Figure 26
Metastasis from melanoma. Coronal oblique T2 (A), coronal oblique T1 (B), sagittal T1 (C) and sagittal T1W sequence post-contrast with fat saturation (D) show a partially necrotic mass with peripheral enhancement behind the clavicle and above the first rib (arrows in A and B and arrowhead in D) exerting mass effect on the divisions of the brachial plexus. Additional metastases are noted in the axillary region and in the right lung.
Figure 27
Figure 27
Neurolymphomatosis (diffuse large B-cell lymphoma). Coronal oblique T2 (A), coronal oblique T1 (B), coronal oblique T1 post-contrast with fat saturation (C) and axial oblique T1W sequences (D,E) demonstrate 2 masses (arrows) at the level of the divisions and cords of the left brachial plexus, which are isointense to muscle in T1, show minimal increased T2 signal as well as post-contrast enhancement. In addition, there is thickening and post-Gadolinium enhancement of the roots and trunks consistent with diffuse involvement of the plexus.
Figure 28
Figure 28
Radiation fibrosis. Coronal oblique T1 (A) and axial oblique T1 (B) show a marked diffuse thickening of the segments of the brachial plexus without evidence of a focal mass lesion in a patient with breast cancer and a history of radiotherapy.
Figure 29
Figure 29
Radiation fibrosis in another patient. Coronal oblique STIR (A) coronal oblique T2 (B), axial oblique T1 (C) and sagittal T1W sequences (D) demonstrate a marked diffuse thickening of the segments of the brachial plexus as well. In addition, there is a significant distortion in the fat signal and architecture in the supraclavicular region and around the plexus in all the sequences. Note the low signal intensity of the segments of the plexus in the STIR and T2W sequences (A,B).

References

    1. Wittenberg KH, Adkins MC. MR imaging of nontraumatic brachial plexopathies: frequency and spectrum of findings. Radiographics. 2000;20(4):1023–1032. - PubMed
    1. Blair DN, Rapoport S, Sostman HD, et al. Normal brachial plexus: MR imaging. Radiology. 1987;165(3):763–767. - PubMed
    1. Van Es HW, Witkamp TD, Feldberg MAM. MRI of the brachial plexus and its region: Anatomy and pathology. Eur J Radiol. 1995;5:145–151.
    1. Castillo M. Brachial and Lumbosacral Plexi. In: Castillo Mauricio., editor. The Core Curriculum. Neuroradiology. 2nd ed. Philadelphia: Lippincott Williams and Wilkins; 2002. pp. 463–473.
    1. Reede DL. MR imaging of the brachial plexus. Magn Reson Imaging Clin N Am. 1997;5(4):897–906. - PubMed

MeSH terms

LinkOut - more resources