. 2014 Feb 28:260:171-84.
doi: 10.1016/j.neuroscience.2013.12.018. Epub 2013 Dec 16.

Modulation of synaptic transmission by adenosine in layer 2/3 of the rat visual cortex in vitro

Affiliations

Modulation of synaptic transmission by adenosine in layer 2/3 of the rat visual cortex in vitro

N M Bannon et al. Neuroscience. .

Abstract

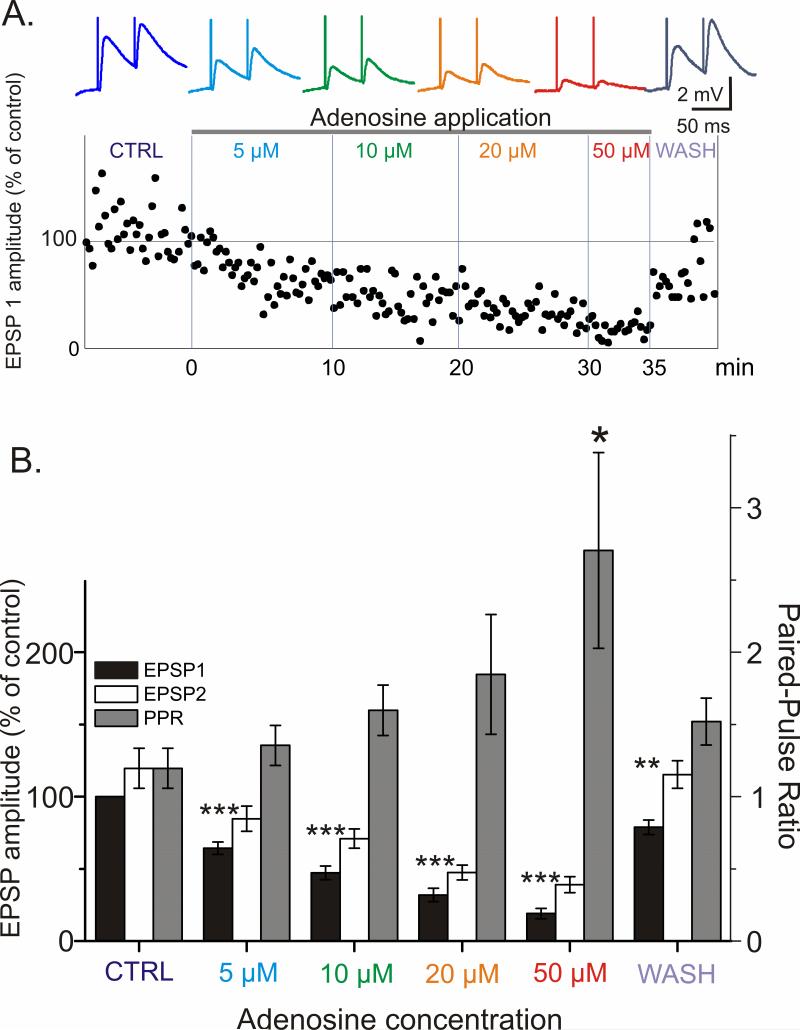
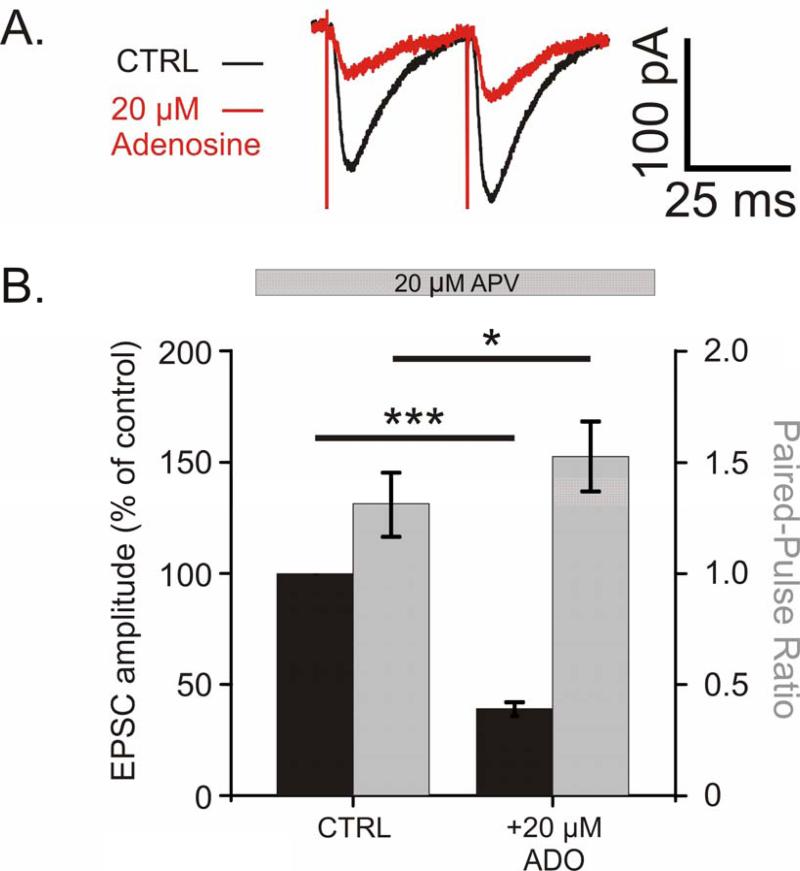
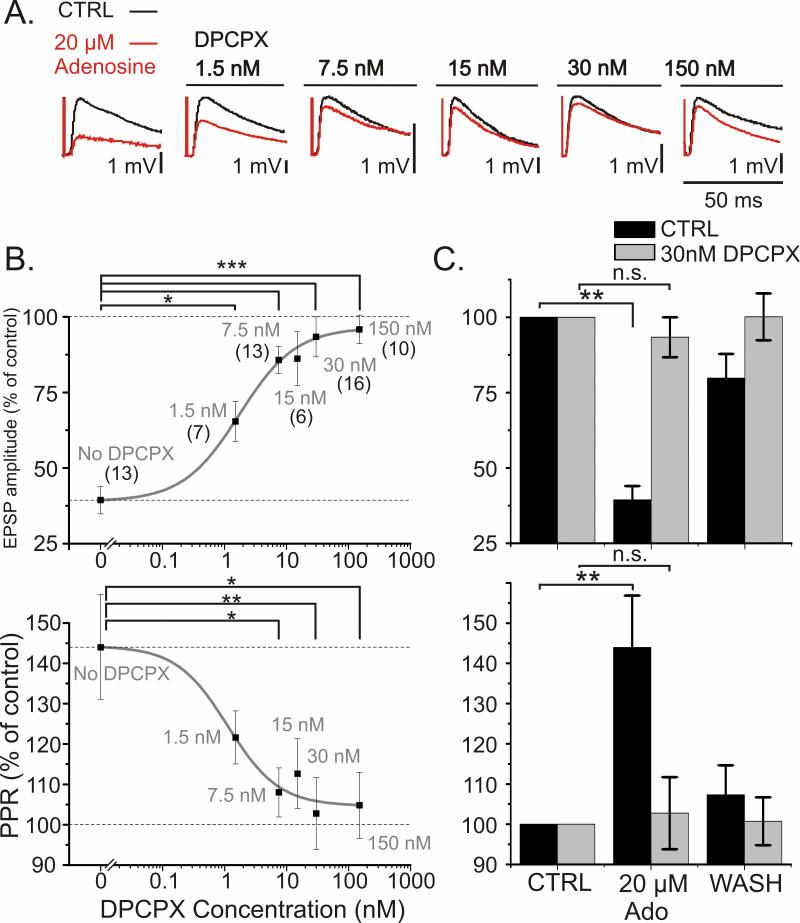
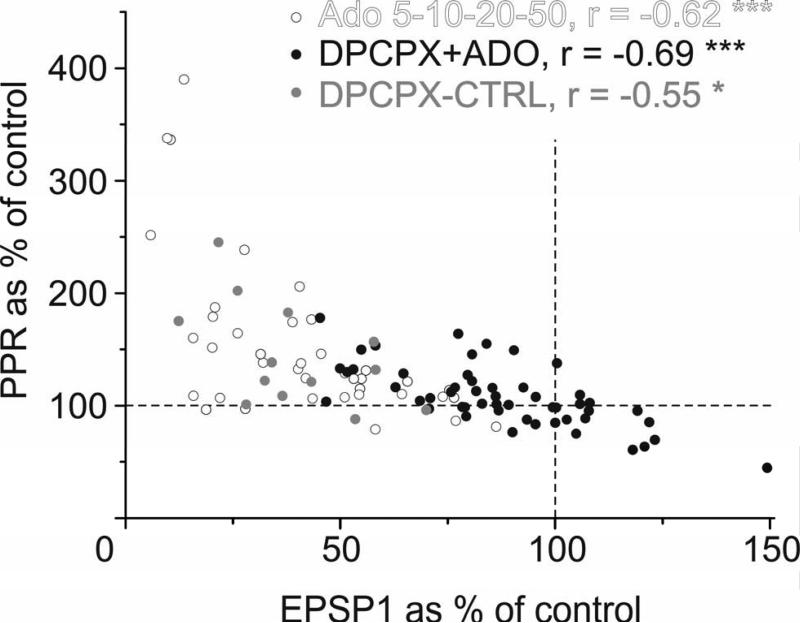
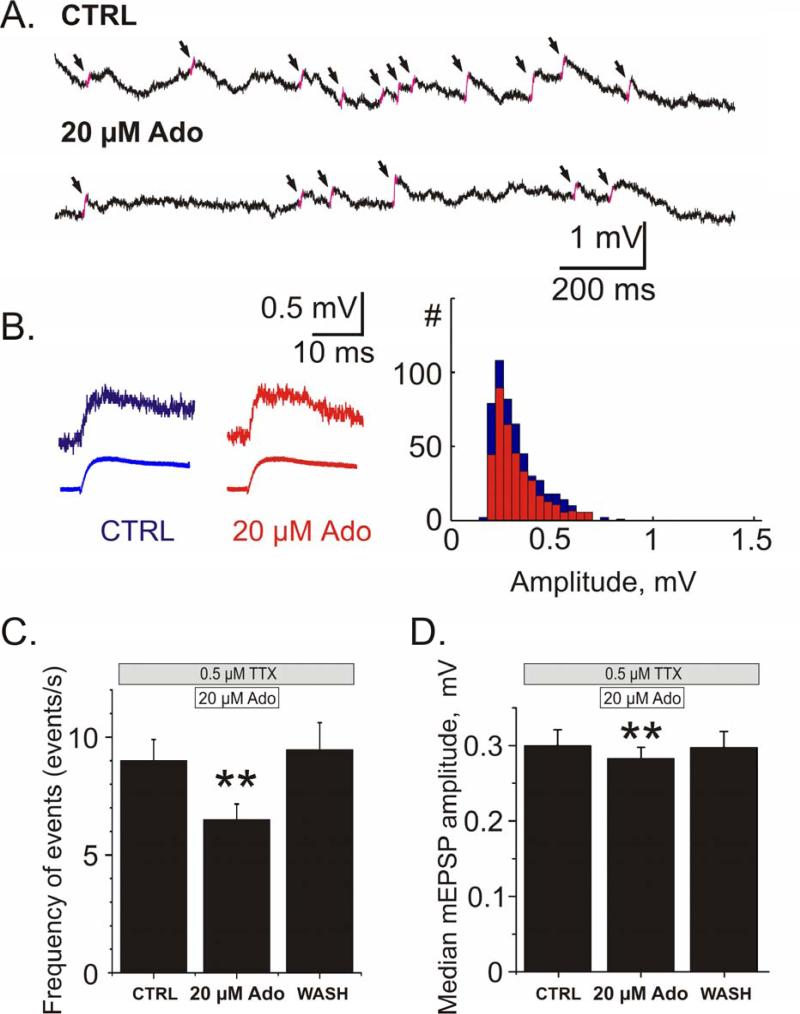
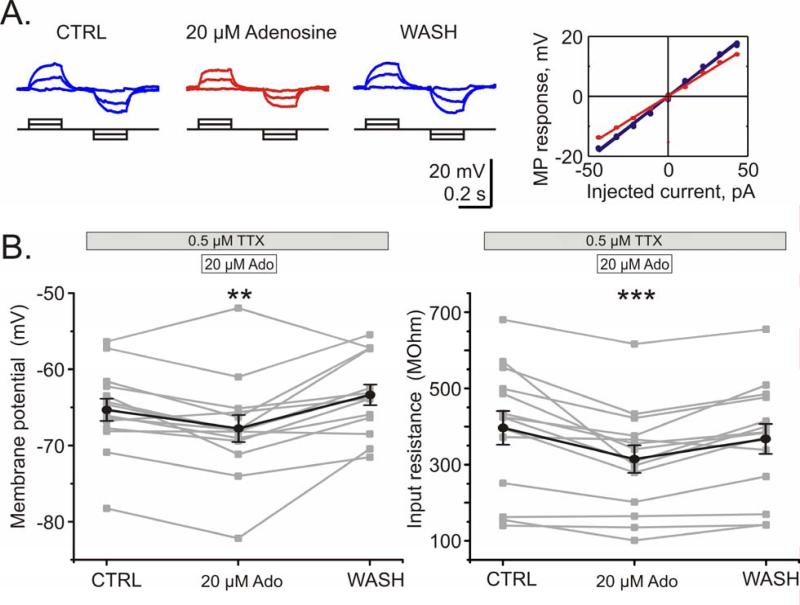
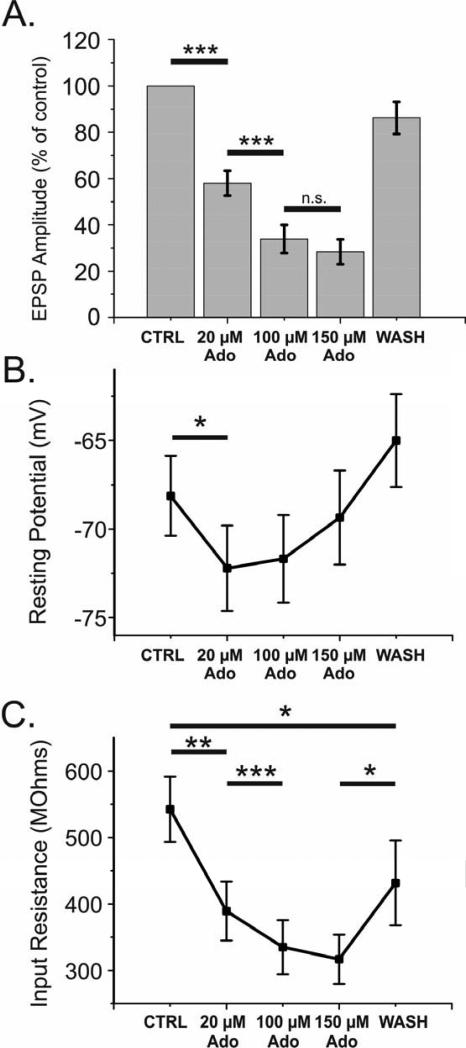
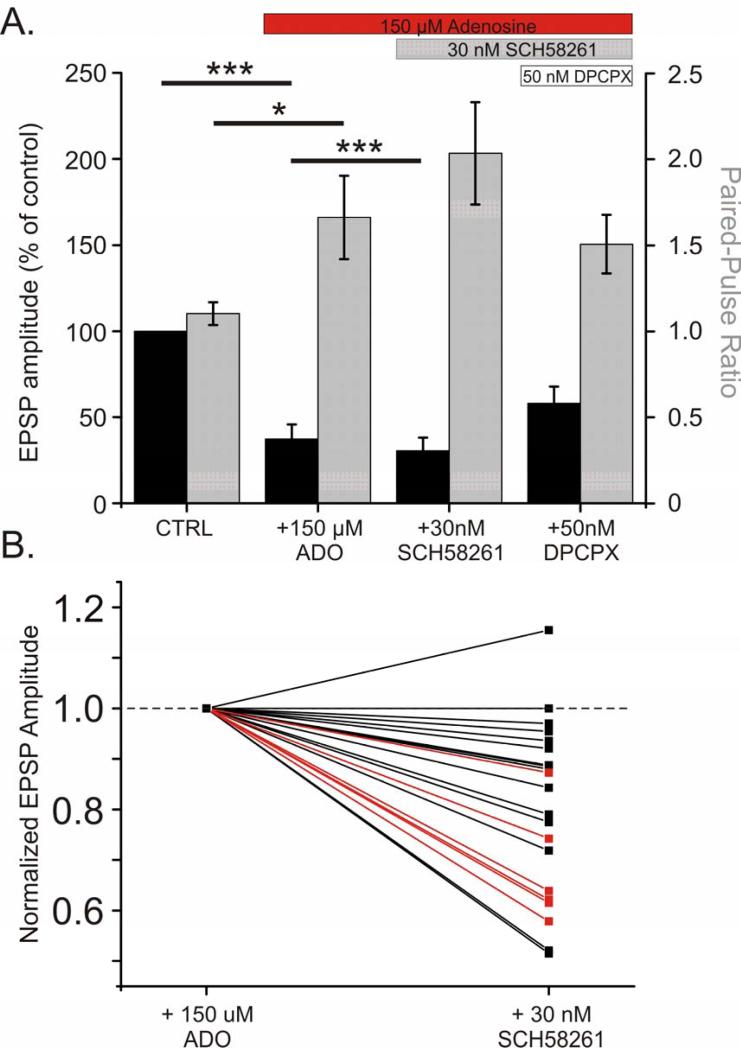
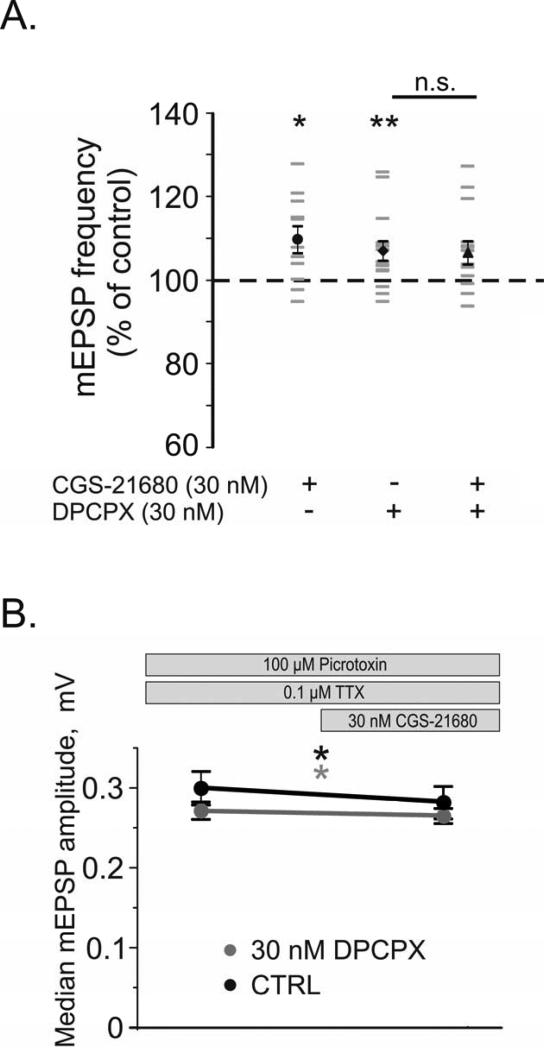
Adenosine is a wide-spread endogenous neuromodulator. In the central nervous system it activates A1 and A2A receptors (A1Rs and A2ARs) which have differential distributions, different affinities to adenosine, are coupled to different G-proteins, and have opposite effects on synaptic transmission. Although effects of adenosine are studied in detail in several brain areas, such as the hippocampus and striatum, the heterogeneity of the effects of A1R and A2AR activation and their differential distribution preclude generalization over brain areas and cell types. Here we study adenosine's effects on excitatory synaptic transmission to layer 2/3 pyramidal neurons in slices of the rat visual cortex. We measured effects of bath application of adenosine receptor ligands on evoked excitatory postsynaptic potentials (EPSPs), miniature excitatory postsynaptic potentials (mEPSPs), and membrane properties. Adenosine reduced the amplitude of evoked EPSPs and excitatory postsynaptic currents (EPSCs), and reduced frequency of mEPSPs in a concentration-dependent and reversible manner. Concurrent with EPSP/C amplitude reduction was an increase in the paired-pulse ratio. These effects were blocked by application of the selective A1R antagonist DPCPX (8-cyclopentyl-1,3-dipropylxanthine), suggesting that activation of presynaptic A1Rs suppresses excitatory transmission by reducing release probability. Adenosine (20μM) hyperpolarized the cell membrane from -65.3±1.5 to -67.7±1.8mV, and reduced input resistance from 396.5±44.4 to 314.0±36.3MOhm (∼20%). These effects were also abolished by DPCPX, suggesting postsynaptic A1Rs. Application of the selective A2AR antagonist SCH-58261 (2-(2-furanyl)-7-(2-phenylethyl)-7H-pyrazolo[4,3-e][1,2,4]triazolo[1,5-c]pyrimidin-5-a-mine) on the background of high adenosine concentrations revealed an additional decrease in EPSP amplitude. Moreover, application of the A2AR agonist CGS-21680 (4-[2-[[6-amino-9-(N-ethyl-β-d-ribofuranuronamidosyl)-9H-purin-2-yl]amino]ethyl]benzenepropanoic acid hydrochloride) led to an A1R-dependent increase in mEPSP frequency. Dependence of the A2AR effects on the A1R availability suggests interaction between these receptors, whereby A2ARs exert their facilitatory effect on synaptic transmission by inhibiting the A1R-mediated suppression. Our results demonstrate functional pre and postsynaptic A1Rs and presynaptic A2ARs in layer 2/3 of the visual cortex, and suggest interaction between presynaptic A2ARs and A1Rs.

Keywords: 2-(2-furanyl)-7-(2-phenylethyl)-7H-pyrazolo[4,3-e][1,2,4]triazolo[1,5-c]pyrimidin-5-a-mine (A(2A)R antagonist); 4-[2-[[6-amino-9-(N-ethyl-β-d-ribofuranuronamidosyl)-9H-purin-2-yl]amino]ethyl]benzenepropanoic acid hydrochloride (A(2A)R agonist); 8-cyclopentyl-1,3-dipropylxanthine (A(1)R antagonist); A(1) and A(2A) receptors; A(1)R; A(2A)R; APV; ATP; Ado; CGS-21680; DPCPX; EPSC; EPSP; SCH-58261; TTX; adenosine; adenosine receptor type 1; adenosine receptor type 2A; adenosine triphosphate; d-(−)-2-amino-5-phosphonopentanoic acid; excitatory postsynaptic current; excitatory postsynaptic potential; mEPSP; miniature excitatory postsynaptic potential; modulation; neocortex; presynaptic; synaptic transmission; tetrodotoxin.


Figures

Fig 1
Fig 1. Scheme of the location of stimulation and recording electrodes in neocortical slices
Recordings were made from layer 2/3 pyramidal neurons while the two stimulation electrodes (S1 and S2) were placed in layer 4 below the recording site.
Fig 2
Fig 2. Adenosine reduces evoked EPSP amplitude and increases paired-pulse ratio (PPR) in a reversible and concentration dependent manner
A. (Above) Traces of averaged EPSPs evoked in a layer 2/3 neuron from visual cortex by paired stimuli (50 ms interpulse interval) in control and through increasing concentrations of adenosine. (Below) The time course of amplitude changes of the responses to the first pulse in a pair (EPSP1, % of control). Data for same cell. B. Changes of the amplitude of EPSP1, EPSP2 and paired-pulse ratio (PPR) induced by increasing concentration of adenosine. EPSP amplitudes were normalized by the amplitude of the EPSP1 in control for each cell, and then averaged for N=5 neurons (10 inputs). Adenosine reduces EPSP amplitude and increases PPR in a concentration dependent and reversible manner. Significance denoted as * p<0.05; **p<0.01; *** p<0.001. Significance for EPSP2 mirrored EPSP1 for all concentrations of adenosine tested, yet “***” is omitted for clarity.
Fig 3
Fig 3. Adenosine reduces the amplitude of EPSCs and increases the paired-pulse ratio
A. Example traces of evoked EPSCs recorded with Cs-based pipette solution in control (black) and with 20 μM adenosine in the bath (red; average of 20 traces for each condition). B. Average reduction in EPSC amplitude as percent of baseline (black bars, n = 10, p<0.001), and average increase in PPR (grey bars, p<0.05) after application of 20 μM adenosine.
Fig 4
Fig 4. A1 receptor antagonist DPCPX blocks adenosine's effects on synaptic transmission
A. Example traces of evoked EPSPs before (black) and after application of 20 μM adenosine (red) on the background of DPCPX. Data for different concentrations of DPCPX are from different cells. B. Concentration dependence of the blockade of adenosine's effects on synaptic transmission by DPCPX. Changes of EPSP1 amplitude (top) and PPR (bottom) induced by bath application of 20 μM adenosine in control (no DPCPX) and on the background of different concentrations of DPCPX. Number of synaptic inputs studied with each DPCPX concentration is indicated in parentheses in the top plot. Solid curves show sigmoid fit to the data points. Significance was calculated for the difference between percent reduction of EPSP amplitude by 20 μM adenosine in control group vs. the reduction in the presence of DPCPX. C. Effects of 20 μM adenosine on synaptic transmission are completely blocked by 30 nM DPCPX. Data from B, but shown with washout of adenosine. Changes of EPSP1 amplitude (top) and PPR (bottom) during application and washout of 20 μM adenosine, in control (black bars) and in the presence of 30 nM DPCPX (grey bars). Note that Y-axes in B, C do not start from zero.
Fig 5
Fig 5. Adenosine induced changes in EPSP amplitude are inversely related to changes in PPR
Changes in PPR plotted against changes in the EPSP1 amplitude. The changes in PPR and EPSP1 amplitude were correlated in all three groups of experiments: Experiments with the application of adenosine at different concentrations (5-50 μM, open circles, r = -0.62, n = 39, p < 0.001); experiments utilizing application of 20 μM adenosine on the background of different concentrations of DPCPX (1.5 - 150 nM, closed circles; r = -0.69, n = 52, p < 0.001); and the control group for these experiments, which utilized 20 μM adenosine but no DPCPX (grey circles, r = −0.55, n = 13, p < 0.05). The changes in EPSP amplitude and PPR are inversely related during all manipulations of A1R activation.
Fig 6
Fig 6. Adenosine reduces miniature EPSP (mEPSP) frequency and decreases the median amplitude of events
A. Example traces of spontaneous activity from one cell in control and in the presence of 20 μM adenosine. The slopes of detected mEPSPs are highlighted in pink and marked with arrows. B. Examples of individual (top) and averaged (bottom; N=509 events for CTRL; N=355 events for Ado) miniature EPSPs and their amplitude distributions from 2.5 min recordings in control and during application of 20 μM adenosine. C, D. Changes of the frequency of mEPSPs (C) and their median amplitude (D) during application of 20 μM adenosine and washout. Both the reduction in frequency of events and median amplitude of events recovered after washout of adenosine. Averaged data for N=18 cells.
Fig 7
Fig 7. Adenosine decreases input resistance and causes hyperpolarization in pyramidal neurons from layer 2/3
A. Membrane potential response of a pyramidal neuron from layer 2/3 to current steps in control, during application of 20 μM adenosine, and after washout. Decreased slope of the voltage-current relationship during adenosine application (red) indicates a decrease of the input resistance. B. Changes of the membrane potential (left) and input resistance (right) during adenosine application and washout. Individual data for N=14 neurons (grey) and their average (black). 20 μM adenosine hyperpolarizes cells and decreases their input resistance. Washout of adenosine demonstrates the reversibility of these effects.
Fig 8
Fig 8. High concentrations of adenosine reveal a saturating effect on reduction of EPSP amplitude, hyperpolarization of membrane, and decrease in input resistance
A. Average reduction in evoked EPSP amplitude as percent of baseline during a bath application of 20, 100, and 150 μM adenosine reveal an upper limit on suppression of the EPSP. 11% (2 of 18) inputs were totally silenced by 100 μM adenosine, yet returned upon washout. B, C. Average changes in membrane potential (B) and input resistance (C) before, during, and after adenosine application. Concentrations of adenosine needed to achieve a maximal effect on hyperpolarization were lower in comparison to concentrations needed to reach maximal effects on reduction of EPSP amplitude and input resistance.
Fig 9
Fig 9. On the background of a saturating concentration of adenosine, blockade of facilitatory A2A receptors by SCH-58261 leads to further reduction of EPSP amplitude
A. Average reduction in evoked EPSP amplitude as percent of baseline (n = 24 inputs from 20 cells; black bars). PPR shown in grey. After application of 150 μM adenosine, 30nM SCH-58261 reduced the EPSP amplitude further, suggesting that under a high concentration of adenosine, the suppressive effect of inhibitory A1Rs is curbed by the activation of facilitatory A2A receptors. B. Changes in normalized EPSP amplitude after the application of 30 nM SCH-58261 for individual inputs. For each input, normalized EPSP amplitudes during 150 μM adenosine and after subsequent addition of 30 nM SCH-58261 are connected with a line. Inputs which demonstrated a significant change (within subjects comparison of 20 individual EPSPs from each condition; p < 0.05, paired t-test) in EPSP amplitude after SCH-58261 application are highlighted in red.
Fig 10
Fig 10. A2AR Agonist CGS-21680 Increases mEPSP frequency and decreased median mEPSP amplitude
A. Changes in the frequency of mEPSPs after application of selective adenosine receptor ligands (shown as % of control). Individual neurons are shown in grey, with averages denoted by black symbols. In N = 11 neurons, the A2AR agonist CGS-21680 (30 nM) increased the frequency of mEPSPs (black circle). In another N = 15 neurons, the A1R antagonist DPCPX (30nM) also increased the frequency of mEPSPs (black diamond). After application of DPCPX, subsequent addition of 30 nM CGS-21680 to these same neurons did not lead to further increase of mEPSP frequency (black triangle). B. Changes in the amplitude of the median mEPSP after CGS-21680 application. In N = 11 neurons, the A2AR agonist CGS-21680 (30 nM) decreased the median mEPSP amplitude (black line). In N = 14 neurons, on the background of 30 nM DPCPX (grey line), 30nM CGS-21680 decreased the median mEPSP amplitude (grey line).

References

    1. Bjorness TE, Greene RW. Adenosine and sleep. Curr. Neuropharmacol. 2009;7:238–245. - PMC - PubMed
    1. Brand A, Vissiennon Z, Eschke D, Nieber K. Adenosine A1 and A3 receptors mediate inhibition of synaptic transmission in rat cortical neurons. Neuropharmacology. 2001;40:85–95. - PubMed
    1. Chaudhuri A, Cohen RZ, Larocque S. Distribution of adenosine A1 receptors in primary visual cortex of developing and adult monkeys. Exp. Brain Res. 1998;123:351–354. - PubMed
    1. Ciruela F, Casadó V, Rodrigues RJ, Luján R, Burgueño J, Canals M, Borycz J, Rebola N, Goldberg SR, Mallol J, Cortés A, Canela EI, López-Giménez JF, Milligan G, Lluis C, Cunha RA, Ferré S, Franco R. Presynaptic control of striatal glutamatergic neurotransmission by adenosine A1-A2A receptor heteromers. J. Neurosci. 2006;26(7):2080–2087. - PMC - PubMed
    1. Ciruela F, Gómez-Soler M, Guidolin D, Borroto-Escuela D, Agnati L, Fuxe K, Fernández-Dueñas V. Adenosine receptor containing oligomers: Their role in the control of dopamine and glutamate neurotransmission in the brain. Biochim. Biophys. Acta. 2011;1808:1245–1255. - PubMed

Publication types