. 2014 Feb 15;87(4):547-61.
doi: 10.1016/j.bcp.2013.11.020. Epub 2013 Dec 16.

(R,R')-4'-methoxy-1-naphthylfenoterol targets GPR55-mediated ligand internalization and impairs cancer cell motility

Affiliations

(R,R')-4'-methoxy-1-naphthylfenoterol targets GPR55-mediated ligand internalization and impairs cancer cell motility

Rajib K Paul et al. Biochem Pharmacol. .

Abstract

(R,R')-4'-Methoxy-1-naphthylfenoterol (MNF) promotes growth inhibition and apoptosis of human HepG2 hepatocarcinoma cells via cannabinoid receptor (CBR) activation. The synthetic CB1R inverse agonist, AM251, has been shown to block the anti-mitogenic effect of MNF in these cells; however, AM251 is also an agonist of the recently deorphanized, lipid-sensing receptor, GPR55, whose upregulation contributes to carcinogenesis. Here, we investigated the role of MNF in GPR55 signaling in human HepG2 and PANC-1 cancer cell lines in culture by focusing first on internalization of the fluorescent ligand Tocrifluor 1117 (T1117). Initial results indicated that cell pretreatment with GPR55 agonists, including the atypical cannabinoid O-1602 and l-α-lysophosphatidylinositol, dose-dependently reduced the rate of cellular T1117 uptake, a process that was sensitive to MNF inhibition. GPR55 internalization and signaling mediated by O-1602 was blocked by MNF in GPR55-expressing HEK293 cells. Pretreatment of HepG2 and PANC-1 cells with MNF significantly abrogated the induction of ERK1/2 phosphorylation in response to AM251 and O-1602. Moreover, MNF exerted a coordinated negative regulation of AM251 and O-1602 inducible processes, including changes in cellular morphology and cell migration using scratch wound healing assay. This study shows for the first time that MNF impairs GPR55-mediated signaling and, therefore, may have therapeutic potential in the management of cancer.

Keywords: Cell motility; Cellular morphology; G-protein coupled receptor; GPR55; Ligand internalization.


Figures

Fig. 1
Fig. 1. Characterization of TAMRA-PPA structure and lack of cellular internalization in HepG2 cells
A, Structure of 5′-TAMRA-3-phenylpropan-1-amine (TAMRA-PPA) and T1117. B, Mass spectrum of TAMPRA-PPA ion, m/z equals 548.0. C, Serum-depleted HepG2 cells were maintained on a confocal microscope stage equipped with a temperature-controlled, humidified CO2 chamber at 37°C, and rates of cellular accumulation of T1117 (10 nM) vs. TAMRA-PPA (20 nM) were determined in ring-shaped regions of interest (ROI) in the cytoplasmic compartments. Plots of signal intensity vs. time were generated from defined ROIs. Note the absence of TAMRA-PPA incorporation in cells.
Fig. 2
Fig. 2. Rapid and saturable incorporation of T1117 in HepG2 cells
Cellular entry of T1117 was measured on a Zeiss 710 confocal microscope with thermoregulated chamber system for live cell imaging. A, Serum-depleted HepG2 cells were incubated in the presence of increasing concentrations of T1117 (2.5–100 nM). Plots of signal intensity vs. time were generated from defined ROIs. Results are from 2–3 independent experiments. B, The area under the curve (AUC) in a plot of T1117 internalization against time was obtained and plotted as bar graphs. Relative AUC data vs. T1117 concentrations is shown, with the T1117-AUC value at 100 nM set at 1. C, The cellular incorporation of T1117 (100 nM) was carried out in the presence of a 100× molar excess of unlabeled AM251. Bars indicate mean ± S.D. (n=3 ROIs) from a single experiment, which was repeated twice with comparable results. D, Representative images at t = 15 min are shown. Bar, 30 μm. DIC, Differential Interference Contrast.
Fig. 3
Fig. 3. A key role for GPR55 in cellular incorporation of T1117
A, Serum-depleted HepG2 cells were pretreated with increasing concentrations of O-1602 for 30 min followed by the addition of 10 nM T1117. B, Bars represent the average T1117-AUC ± S.D. (n=3 independent experiments). C and D, HepG2 cells seeded in 96-well plates were serum-starved and subjected to O-1602 (C) and LPI (D) treatment at the indicated concentrations for 30 min. Cellular incorporation of T1117 was carried out as indicated in Material and Methods, method 2. Bars indicate mean ± S.D. of averaged T1117 ROI intensities from 8 wells across two independent experiments. **, *** P < 0.01 and 0.001, respectively.
Fig. 4
Fig. 4. Key role of GPR55 in cellular incorporation of T1117
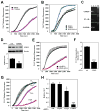
A, Serum-depleted HepG2 cells were treated with vehicle (0.01% DMSO) or CP 55,940 (0.25μM) for 30 min followed by the addition of 10 nM T1117. B, AM630 (1μM), WIN 55,212-2 (1μM). A and B, Bars indicate mean ± S.D. (n=3 ROIs) from single experiment, which was repeated twice with comparable results. C, Expression of GPR55, β2-AR and GAPDH mRNA was determined by semi-quantitative PCR analysis in PANC-1 (lane 1) and HepG2 (lane 2) cells. Water control is shown in lane 3. M, size markers. D, PANC-1 cells were treated with non-silencing control siRNA (crtl) or GPR55 siRNA oligos for 48 h. Levels of GPR55 were determined in cell lysates by Western blotting and normalized to β-actin. Upper panel, representative immunoblot; Lower panel, Bars represent the mean ± SEM from three independent experiments, each performed in duplicate dishes. **, P < 0.05. E, PANC-1 cells transfected for 48 h with control (crtl) and GPR55 siRNAs were serum-starved for 3 h followed by the addition of 10 nM T1117. Plots of signal intensity vs. time were generated from defined ROIs. Bars indicate mean ± S.E.M. of 3 independent experiments, each performed with 3–4 ROIs. F, Relative T1117-AUC data in PANC-1 cells with control siRNA values set at 1. G, HepG2 cells were transfected with siRNA oligos either against CB1R, CB2R or GPR55 or the non-silencing siRNA control for 48 h. Cells were maintained in serum-free medium for 3 h followed by the addition of 10 nM T1117. Plots of signal intensity vs. time were generated from defined ROIs. Bars indicate mean ± S.E.M. of 3 independent experiments, each performed with 3–4 ROIs. H, Relative T1117-AUC data in HepG2 cells with control siRNA values set at 1. *, *** P < 0.05 and 0.001, respectively.
Fig. 5
Fig. 5. Effect of MNF on cellular uptake of T1117
A, Dose-response study of MNF (10nM–10μM) was carried out in serum-depleted HepG2 cells incubated with 10 nM T1117. Each datapoint represents the mean ± S.E.M. of T1117-AUC data normalized to DMSO controls (n=3 experiments). B–D, Serum-depleted HepG2 (B) and PANC-1 (C) cells were pretreated with vehicle or MNF (1 μM) for 30 min followed by the addition of 10 nM T1117. Plots of signal intensity vs. time were generated from defined ROIs. D, Bars represent the mean ± S.E.M. of T1117-AUC data normalized to the DMSO controls (n=3). ***, P < 0.001.
Fig. 6
Fig. 6. MNF impairs ligand-induced GPR55 internalization and signaling
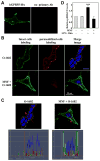
HEK293 cells stably transfected with 3xHA-tagged hGPR55 vector (panel A) were serum-starved, and then incubated with anti-HA antibody in the absence or presence of MNF (1 μM) for 45 min at 37 °C. After extensive washing, O-1602 (5 μM) was added to the cells for 20 min at 37 °C to promote GPR55 internalization. Intact cells were fixed and then incubated with anti-rabbit Alexa Fluor 488 antibody (green) to label cell surface GPR55. After a permeabilization step, anti-rabbit Alexa Fluor 568 antibody (red) was added to detect intracellular GPR55. Nuclei were counterstained with DAPI (blue). Yellow indicates signal coalescence in the merged images. Scale bar = 20 μm. C, Merged images with pixel intensities for cell surface GPR55 (green), internalized GPR55 (red) and nuclei (blue) are shown. D, GPR55-expressing HEK293 cells were incubated in the absence or presence of 100 nM MNF for 15 min followed by the addition of LPI (1 μM) + rimonabant (10 μM) for 10 min. The rationale of having used two GPR55 agonists together stemmed from the recent observation that AM251 and rimonabant are allosteric ligands of GPR55 in addition to their capacity to modulate the LPI (ligand)-binding site through different pharmacophores [46]. The detection of phosphorylated ERK was carried out with a Perkin Elmer Alphascreen Surefire kit and the signal normalized to total ERK levels. Rimonabant alone had no effect on basal ERK phosphorylation levels, although the LPI response was enhanced. ***, P < 0.001 (n=3 independent experiments).
Fig. 7
Fig. 7. Impairment in GPR55 downstream signaling by MNF
Serum-depleted HepG2 (A, B) and PANC-1 (C, D) cells were pretreated or not in the presence of MNF (1 μM) for 10 min followed by the addition of vehicle, O-1602 (2.5 and 10 μM), or 10% FBS for an additional 10 min. Cell lysates were prepared, separated by reducing SDS-PAGE gel electrophoresis and immunoblotted for total and phosphoactive forms of ERK. A and C, Representative immunoblots; B and D, Phospho-ERK1/2 bands were normalized to total ERK2, and the O-1602-10μM values were set at 1. Data are means of two independent dishes ± range. The migration of molecular-mass markers (values in kilodaltons) is shown on the left of immunoblots. E and F, PANC-1 cells were transfected with control (crtl) or GPR55 siRNA for 48 h, and then were serum-starved for 3 h. ERK1/2 phosphorylation was monitored in cell lysates from vehicle or O-1602 (10 μM)-treated cells. E, Representative immunoblots; F, Signals associated with phospho-active ERK1/2 was normalized to β-actin. Bars represent the mean ± SEM from three independent experiments. *, P < 0.05.
Fig. 8
Fig. 8. MNF interferes with inducible changes in cell morphology and expression of EGFR
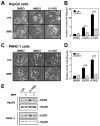
Serum-starved HepG2 (A) and PANC-1 (C) cells were pre-incubated in the presence of DMSO (0.1%) or MNF (1 μM) for 30 min followed by the addition of AM251 (5 μM) or O-1602 (5 μM) for 16 h. Unstimulated PANC-1 cells displayed cuboidal morphology with and without MNF. White arrows show individual cells with filopodia. B and D, Bars represent the average number of cells with filipodia per ‘frame’ ± SEM (n=16). Each frame contained an average of 50 and 15 cells for HepG2 and PANC-1 cells, respectively. **, *** P < 0.01 and 0.001. E, Cell lysates were prepared from similar experiments and immunoblotted for EGFR. The membranes were reprobed for Hsp90, which served as a loading control.
Fig. 9
Fig. 9. MNF inhibits ligand-induced motility of HepG2 and PANC-1 cells in a wound-healing assay
Confluent HepG2 (A, B, C) and PANC-1 (D, E, F) cells were subjected to scratch wound as described in Materials and Methods. Cells were incubated in the presence of DMSO (0.1%) or the GPR55 agonist AM251 (1 μM) for 30 min, followed by the addition of MNF (1 μM) where indicated. Images were captured at various time-points. B and E, The relative wound surface area was measured over time and plotted, and values at time 0 were set at 1. C and F, The relative wound surface area of four independent observations at the 24-h time point is plotted. *, *** P < 0.05 and 0.001.
Fig. 10
Fig. 10. Schematic diagram of the modulation of GPR55 signaling
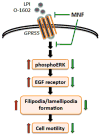
Binding of agonists, such as LPI and O-1602, elicits the activation of GPR55 and its downstream signaling cascade ultimately resulting in increased cancer cell motility. Cell treatment with (R,R′)-MNF has the capacity to inhibit the pro-oncogenic activity of GPR55.

Similar articles

Cited by

References

    1. Jozwiak K, Khalid C, Tanga MJ, Berzetei-Gurske I, Jimenez L, Kozocas JA, et al. Comparative molecular field analysis of the binding of the stereoisomers of fenoterol and fenoterol derivatives to the beta2 adrenergic receptor. J Med Chem. 2007;50:2903–15. - PubMed
    1. Jozwiak K, Woo AY, Tanga MJ, Toll L, Jimenez L, Kozocas JA, et al. Comparative molecular field analysis of fenoterol derivatives: A platform towards highly selective and effective beta(2)-adrenergic receptor agonists. Bioorg Med Chem. 2010;18:728–36. - PMC - PubMed
    1. Toll L, Jimenez L, Waleh N, Jozwiak K, Woo AY, Xiao RP, et al. {Beta}2-adrenergic receptor agonists inhibit the proliferation of 1321N1 astrocytoma cells. J Pharmacol Exp Ther. 2011;336:524–32. - PMC - PubMed
    1. Paul RK, Ramamoorthy A, Scheers J, Wersto RP, Toll L, Jimenez L, et al. Cannabinoid receptor activation correlates with the proapoptotic action of the beta2-adrenergic agonist (R,R′)-4-methoxy-1-naphthylfenoterol in HepG2 hepatocarcinoma cells. J Pharmacol Exp Ther. 2012;343:157–66. - PMC - PubMed
    1. Milligan G. G protein-coupled receptor hetero-dimerization: contribution to pharmacology and function. Br J Pharmacol. 2009;158:5–14. - PMC - PubMed

Publication types

MeSH terms