

A system for accurate and automated injection of hyperpolarized substrate with minimal dead time and scalable volumes over a large range
- PMID: 24355621
- PMCID: PMC3969585
- DOI: 10.1016/j.jmr.2013.10.024
A system for accurate and automated injection of hyperpolarized substrate with minimal dead time and scalable volumes over a large range
Abstract
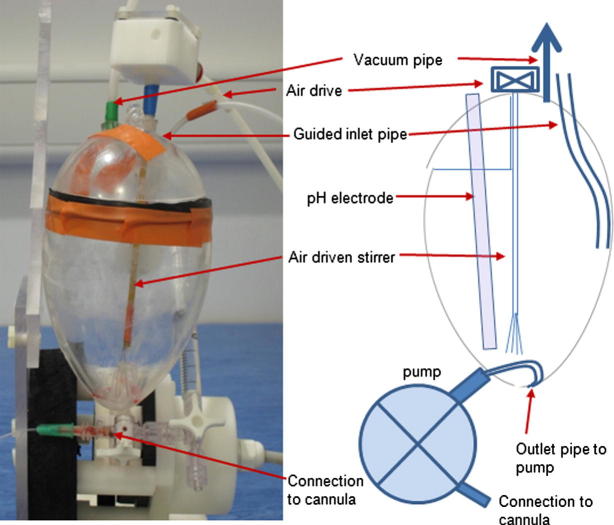
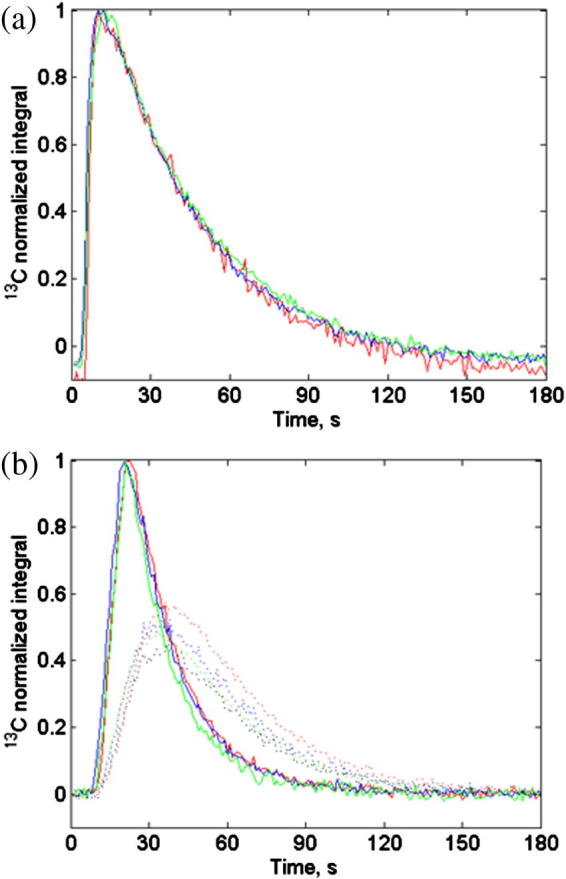
Over recent years hyperpolarization by dissolution dynamic nuclear polarization has become an established technique for studying metabolism in vivo in animal models. Temporal signal plots obtained from the injected metabolite and daughter products, e.g. pyruvate and lactate, can be fitted to compartmental models to estimate kinetic rate constants. Modeling and physiological parameter estimation can be made more robust by consistent and reproducible injections through automation. An injection system previously developed by us was limited in the injectable volume to between 0.6 and 2.4ml and injection was delayed due to a required syringe filling step. An improved MR-compatible injector system has been developed that measures the pH of injected substrate, uses flow control to reduce dead volume within the injection cannula and can be operated over a larger volume range. The delay time to injection has been minimized by removing the syringe filling step by use of a peristaltic pump. For 100μl to 10.000ml, the volume range typically used for mice to rabbits, the average delivered volume was 97.8% of the demand volume. The standard deviation of delivered volumes was 7μl for 100μl and 20μl for 10.000ml demand volumes (mean S.D. was 9 ul in this range). In three repeat injections through a fixed 0.96mm O.D. tube the coefficient of variation for the area under the curve was 2%. For in vivo injections of hyperpolarized pyruvate in tumor-bearing rats, signal was first detected in the input femoral vein cannula at 3-4s post-injection trigger signal and at 9-12s in tumor tissue. The pH of the injected pyruvate was 7.1±0.3 (mean±S.D., n=10). For small injection volumes, e.g. less than 100μl, the internal diameter of the tubing contained within the peristaltic pump could be reduced to improve accuracy. Larger injection volumes are limited only by the size of the receiving vessel connected to the pump.
Keywords: Dead space minimization; Hyperpolarization; In vivo automated injection system; Large volume range.
Copyright © 2013 The Authors. Published by Elsevier Inc. All rights reserved.
Figures


Similar articles
-
Dynamic 1 H imaging of hyperpolarized [1-13 C]lactate in vivo using a reverse INEPT experiment.Magn Reson Med. 2018 Feb;79(2):741-747. doi: 10.1002/mrm.26725. Epub 2017 May 5. Magn Reson Med. 2018. PMID: 28474393 Free PMC article.
-
A regional bolus tracking and real-time B1 calibration method for hyperpolarized 13 C MRI.Magn Reson Med. 2019 Feb;81(2):839-851. doi: 10.1002/mrm.27391. Epub 2018 Sep 18. Magn Reson Med. 2019. PMID: 30277268 Free PMC article.
-
Production of highly polarized [1-13 C]acetate by rapid decarboxylation of [2-13 C]pyruvate - application to hyperpolarized cardiac spectroscopy and imaging.Magn Reson Med. 2019 Sep;82(3):1140-1149. doi: 10.1002/mrm.27782. Epub 2019 May 2. Magn Reson Med. 2019. PMID: 31045272
-
Hyperpolarized agents for advanced MRI investigations.Q J Nucl Med Mol Imaging. 2009 Dec;53(6):604-17. Q J Nucl Med Mol Imaging. 2009. PMID: 20016452 Review.
-
Hyperpolarized sodium 1-[13C]pyruvate.2008 Jan 29 [updated 2008 Feb 28]. In: Molecular Imaging and Contrast Agent Database (MICAD) [Internet]. Bethesda (MD): National Center for Biotechnology Information (US); 2004–2013. 2008 Jan 29 [updated 2008 Feb 28]. In: Molecular Imaging and Contrast Agent Database (MICAD) [Internet]. Bethesda (MD): National Center for Biotechnology Information (US); 2004–2013. PMID: 20641814 Free Books & Documents. Review.
Cited by
-
Direct arterial injection of hyperpolarized 13 C-labeled substrates into rat tumors for rapid MR detection of metabolism with minimal substrate dilution.Magn Reson Med. 2017 Dec;78(6):2116-2126. doi: 10.1002/mrm.26628. Epub 2017 Feb 12. Magn Reson Med. 2017. PMID: 28191664 Free PMC article.
-
Implementation and characterization of flow injection in dissolution dynamic nuclear polarization NMR spectroscopy.Chemphyschem. 2015 Aug 24;16(12):2646-52. doi: 10.1002/cphc.201500292. Epub 2015 Jul 2. Chemphyschem. 2015. PMID: 26139513 Free PMC article.
-
Continuous-flow DNP polarizer for MRI applications at 1.5 T.Sci Rep. 2017 Mar 14;7:44010. doi: 10.1038/srep44010. Sci Rep. 2017. PMID: 28290535 Free PMC article.
-
Probing carbohydrate metabolism using hyperpolarized 13 C-labeled molecules.NMR Biomed. 2019 Oct;32(10):e4018. doi: 10.1002/nbm.4018. Epub 2018 Nov 26. NMR Biomed. 2019. PMID: 30474153 Free PMC article. Review.
References
-
- Kurhanewicz J., Vigneron D.B., Brindle K., Chekmenev E.Y., Comment A., Cunningham C.H., Deberardinis R.J., Green G.G., Leach M.O., Rajan S.S., Rizi R.R., Ross B.D., Warren W.S., Malloy C.R. Analysis of cancer metabolism by imaging hyperpolarized nuclei: prospects for translation to clinical research. Neoplasia. 2011;13:81–97. - PMC - PubMed
-
- Kazan S.M., Reynolds S., Kennerley A., Wholey E., Bluff J.E., Berwick J., Cunningham V.J., Paley M.N., Tozer G.M. Kinetic modeling of hyperpolarized 13C pyruvate metabolism in tumors using a measured arterial input function. Magn. Reson. Med. 2013;70:943–953. - PubMed
Publication types
MeSH terms
Substances
Grants and funding
LinkOut - more resources
Full Text Sources
Other Literature Sources
