. 2014 Jan;124(1):448-60.
doi: 10.1172/JCI69666. Epub 2013 Dec 20.

Angiotensin II-dependent TGF-β signaling contributes to Loeys-Dietz syndrome vascular pathogenesis

Angiotensin II-dependent TGF-β signaling contributes to Loeys-Dietz syndrome vascular pathogenesis

Elena M Gallo et al. J Clin Invest. 2014 Jan.

Abstract

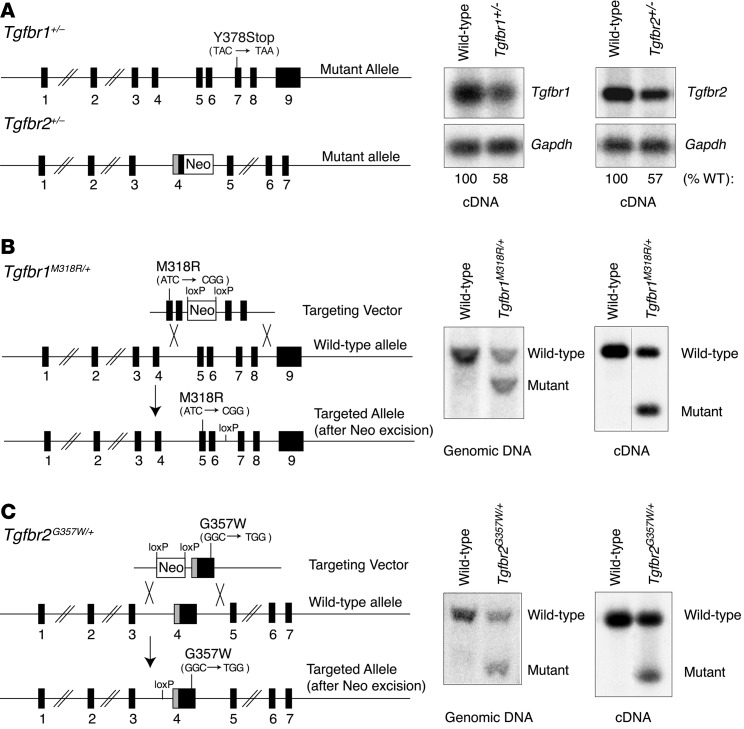
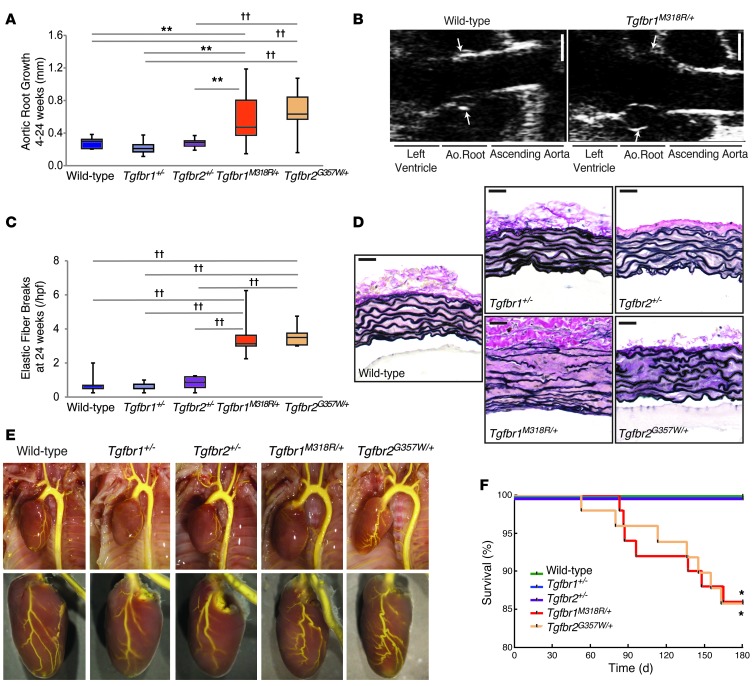
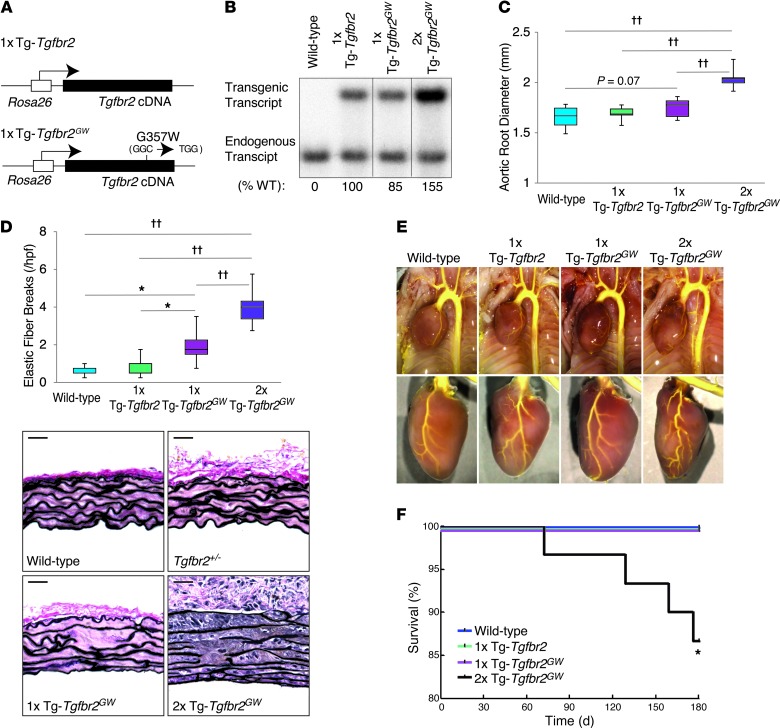
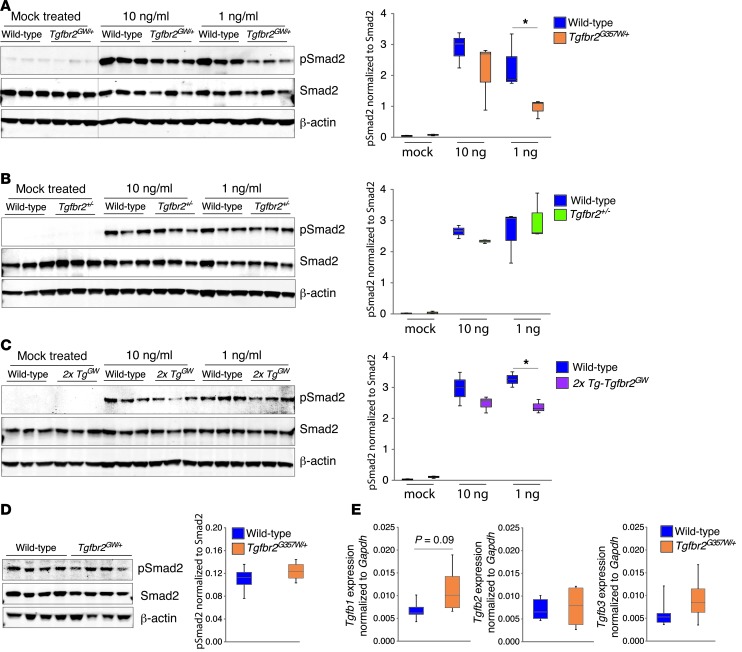
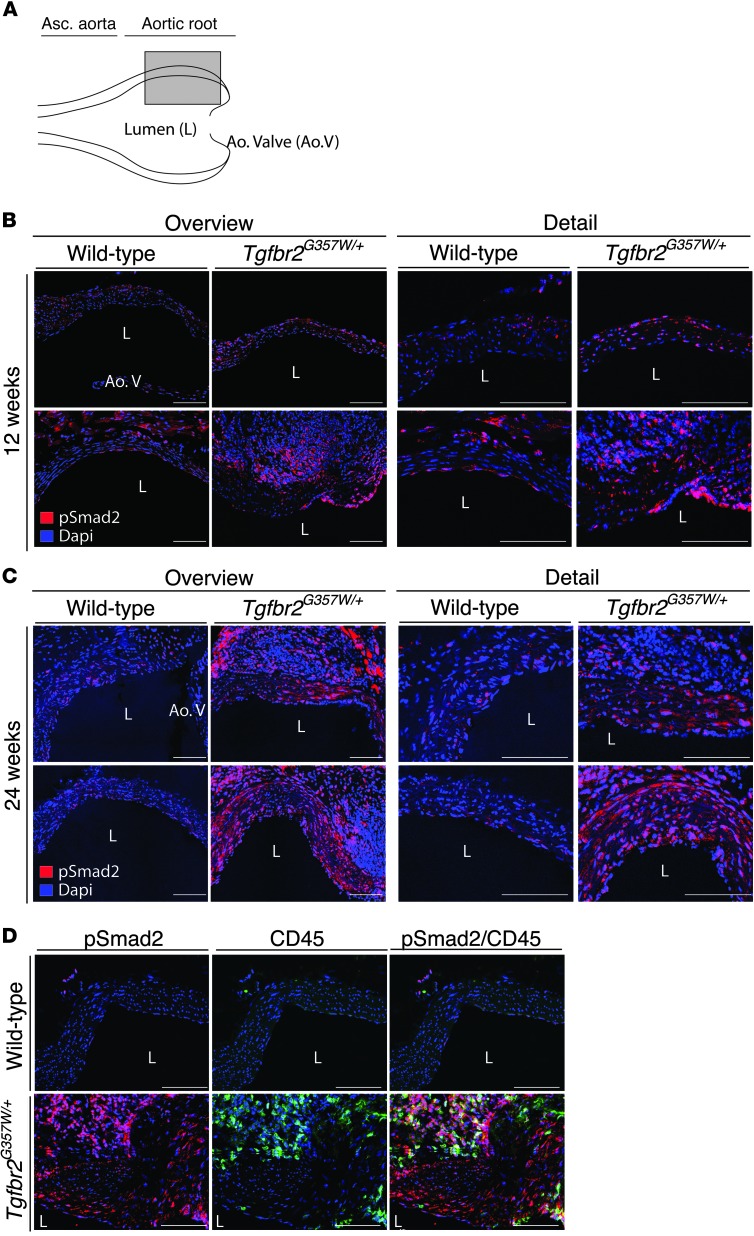
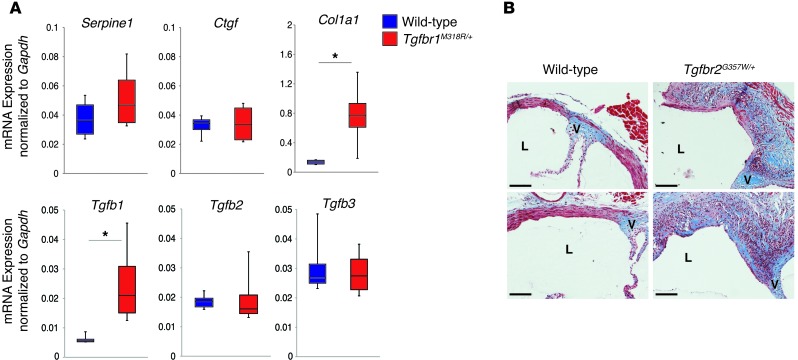
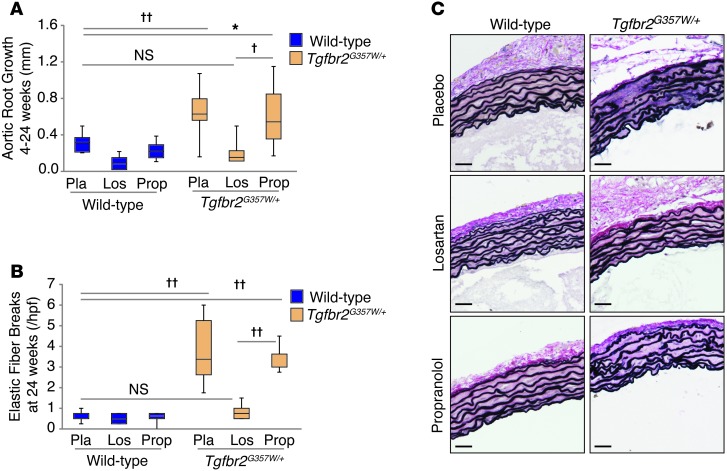
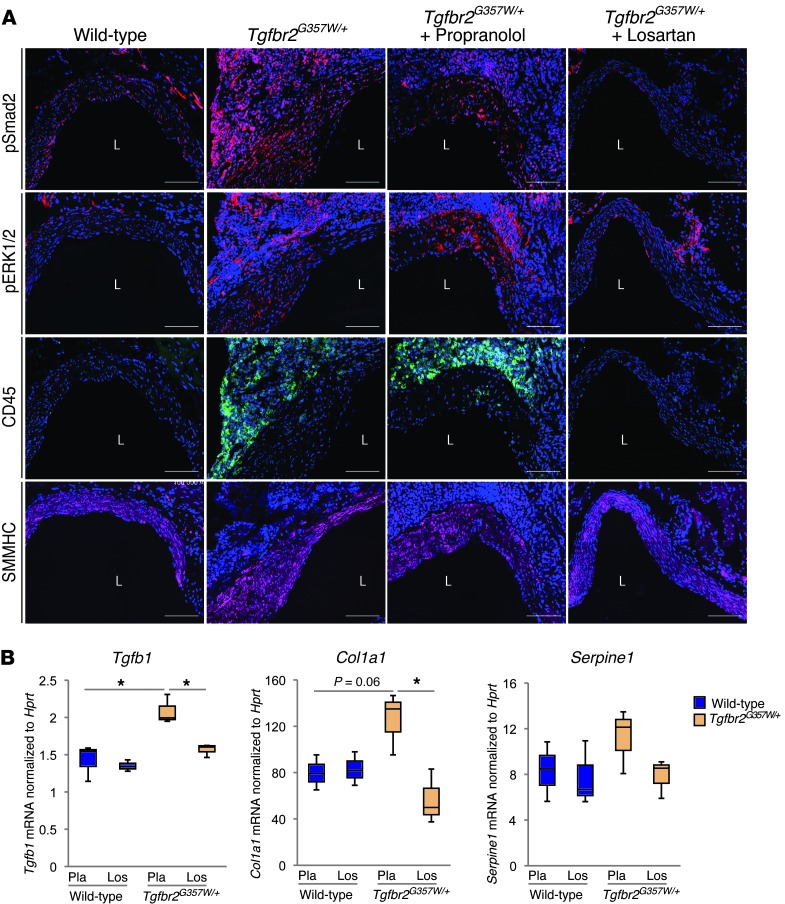
Loeys-Dietz syndrome (LDS) is a connective tissue disorder that is characterized by a high risk for aneurysm and dissection throughout the arterial tree and phenotypically resembles Marfan syndrome. LDS is caused by heterozygous missense mutations in either TGF-β receptor gene (TGFBR1 or TGFBR2), which are predicted to result in diminished TGF-β signaling; however, aortic surgical samples from patients show evidence of paradoxically increased TGF-β signaling. We generated 2 knockin mouse strains with LDS mutations in either Tgfbr1 or Tgfbr2 and a transgenic mouse overexpressing mutant Tgfbr2. Knockin and transgenic mice, but not haploinsufficient animals, recapitulated the LDS phenotype. While heterozygous mutant cells had diminished signaling in response to exogenous TGF-β in vitro, they maintained normal levels of Smad2 phosphorylation under steady-state culture conditions, suggesting a chronic compensation. Analysis of TGF-β signaling in the aortic wall in vivo revealed progressive upregulation of Smad2 phosphorylation and TGF-β target gene output, which paralleled worsening of aneurysm pathology and coincided with upregulation of TGF-β1 ligand expression. Importantly, suppression of Smad2 phosphorylation and TGF-β1 expression correlated with the therapeutic efficacy of the angiotensin II type 1 receptor antagonist losartan. Together, these data suggest that increased TGF-β signaling contributes to postnatal aneurysm progression in LDS.


Figures

Figure 1
Figure 1. Mouse models of TGF-β receptor haploinsufficiency and LDS.
(A) Structure of Tgfbr1 and Tgfbr2 mutant alleles in haploinsufficient mouse models. A stop mutation is present in exon 7 of the Tgfbr1 mutant allele; a NeoR replaces part of exon 4 in the Tgfbr2 mutant allele, creating a frameshift. These alterations result in an approximately 50% reduction in expression of the corresponding cDNA in aortic tissue derived from Tgfbr1+/– and Tgfbr2+/– haploinsufficient mice, as assessed by RT-PCR and indicated underneath the blots. (B) Structure of the Tgfbr1M318R mutant allele. ES cell targeting was verified by Southern blot. Expression of the mutant cDNA in aortic tissue derived from Tgfbr1M318R/+ mice was verified by RT-PCR. NciI restriction digest allows for discrimination of wild-type and mutant cDNA (the black line indicates lanes that were run on the same gel but were noncontiguous). (C) Schematic illustrating the genomic structure of the Tgfbr2G357W mutant allele. ES cell targeting was verified by Southern blot. Expression of the mutant cDNA in aortic tissue derived from Tgfbr2G357W/+ mice was evaluated by RT-PCR. AlwI restriction digest allows for discrimination of wild-type and mutant cDNA.
Figure 2
Figure 2. Knockin LDS mutant mice, but not TGF-β receptor haploinsufficient mice, recapitulate vascular LDS phenotypes.
(A) Aortic root growth from 4 to 24 weeks of age in LDS knockin and haploinsufficient mouse models, as measured by echocardiography (n ≥ 9). (B) Representative echocardiographic images of the aortic roots (arrows) of wild-type and Tgfbr1M318R/+ mice at 24 weeks of age. Scale bar: 1 mm. (C) Quantification of elastic fiber breaks per high-power field (hpf) in LDS knockin and haploinsufficient mouse models (n ≥ 6). (A and C) The upper and lower margins of the box define the 75th and 25th percentiles, respectively; the internal line defines the median, and the whiskers define the range. (D) Representative aortic wall sections of LDS knockin and haploinsufficient mouse models, at 24 weeks of age, stained with VVG for elastin. Scale bar: 40 μm. (E) Representative images of vascular anatomy in LDS knockin and haploinsufficient mouse models. (F) Kaplan-Meier survival curve showing diminished life span of Tgfbr1M318R/+ and Tgfbr2G357W/+ mice but not haploinsufficient mice (wild-type, n = 46; Tgfbr1+/–, n = 39; Tgfbr2+/–, n = 32; Tgfbr1M318R/+, n = 50; Tgfbr2G357W/+, n = 49). *P < 0.05, **P < 0.005, ††P < 0.00005.
Figure 3
Figure 3. Transgenic mice overexpressing the Tgfbr2G357W mutant allele recapitulate vascular LDS phenotypes.
(A) Schematic representation of control (1x Tg-Tgfbr2) and mutant (1x Tg-Tgfbr2GW) transgenic constructs, both under the control of the Rosa26 promoter. (B) Expression of endogenous and transgenic cDNA in aortic tissue of 1x Tg-Tgfbr2, 1x Tg-Tgfbr2GW, and control mice, as evaluated by RT-PCR and indicated underneath the blots. After digestion with the restriction enzyme MfeI, which cuts the transgenic (both control and mutant) but not the endogenous cDNA, the PCR product was incubated with a radioactive probe specific for the Tgfbr2 cDNA (the black lines indicate lanes that were run on the same gel but were noncontiguous). (C) Aortic root diameter of 24-week-old mice, as measured by echocardiography (n ≥ 6). (D) Quantification of elastin fiber breaks per high-power field in control and mutant transgenic mice (n ≥ 6) and representative VVG-stained aortic root sections from 24-week-old wild-type and transgenic mice. (C and D) The upper and lower margins of the box define the 75th and 25th percentiles, respectively; the internal line defines the median, and the whiskers define the range. Scale bar: 40 μm. (E) Representative images of vascular anatomy in control and transgenic mouse models. (F) Kaplan-Meier survival curve showing reduced life span for 2x Tg-Tgfbr2GW mice but not for 1x Tg-Tgfbr2 and 1x Tg-Tgfbr2GW mice (wild-type, n = 25; 1x Tg-Tgfbr2, n = 23; 1x Tg-Tgfbr2GW, n = 26; 2x Tg-Tgfbr2GW, n = 30). *P < 0.05, ††P < 0.00005.
Figure 4
Figure 4. Defective TGF-β receptor signaling in LDS VSMCs in response to exogenous ligand but not under normal culture conditions.
(A) Aortic VSMCs derived from wild-type and Tgfbr2G357W/+ mice were starved for 24 hours in 2% serum and then exposed to 10 or 1 ng/ml TGF-β1 for 1 hour. Signaling events were assayed by Western blot (the black line indicates lanes that were run on the same gel but were noncontiguous) (n = 3). (B) Western blot analysis of wild-type and Tgfbr2+/– VSMCs stimulated as in A (n = 3). (C) Western blot analysis of wild-type and 2x Tg-Tgfbr2GW VSMCs stimulated as in A (n = 3). (D) Levels of pSmad2 in unstimulated control and Tgfbr2G357W/+ VSMCs grown in 5% serum to approximately 80% confluence prior to analysis (n = 4). (E) Analysis of Tgfb1, Tgfb2, and Tgfb3 expression in control and Tgfbr2G357W/+ VSMCs cultured as in D (n = 4). The upper and lower margins of the box define the 75th and 25th percentiles, respectively; the internal line defines the median, and the whiskers define the range. *P < 0.05.
Figure 5
Figure 5. Progressive upregulation of pSmad2 in aortic tissue of LDS knockin mice.
(A) Long-axis view used to acquire immunofluorescence images. The gray box indicates the approximate area used for imaging. Each image is shown at lower (overview) and higher (detail) resolution. (B) Representative images of pSmad2 in the aortic roots of 12-week-old Tgfbr2G357W/+ and control mice. (C) Representative images of pSmad2 in the aortic roots of 24-week-old Tgfbr2G357W/+ and control mice. (D) Representative images of pSmad2 and CD45 staining in the aortic roots of 24-week-old Tgfbr2G357W/+ and control mice. Images were acquired as a tile with a ×25 magnification. Scale bar: 100 μm.
Figure 6
Figure 6. Upregulation of TGF-β1 ligand and collagen in LDS mice at 24 weeks of age.
(A) Expression of TGF-β ligands and TGF-β gene targets in aortic root samples from 24-week-old Tgfbr1M318R/+ mice, as evaluated by qPCR (n = 4). The upper and lower margins of the box define the 75th and 25th percentiles, respectively; the internal line defines the median, and the whiskers define the range. *P < 0.05. (B) Masson trichrome staining of representative sections of the aortic roots of control and Tgfbr2G357W/+ mice at 24 weeks of age. L, lumen; V, aortic valve annulus. Scale bar: 200 μm.
Figure 7
Figure 7. Treatment with the angiotensin II receptor 1 inhibitor losartan ameliorates LDS vascular pathology.
(A) Aortic root growth from 4 to 24 weeks of age, as measured by echocardiography, in Tgfbr2G357W/+ and control mice treated with placebo, propranolol, or losartan (n ≥ 8). (B) Elastic fiber breaks per high-power field in Tgfbr2G357W/+ and control mice treated with placebo, propranolol, or losartan (n ≥ 8). (A and B) The upper and lower margins of the box define the 75th and 25th percentiles, respectively; the internal line defines the median, and the whiskers define the range. (C) VVG staining of representative sections of the proximal ascending aortas of Tgfbr2G357W/+ and control mice treated with placebo, propranolol, or losartan. Scale bar: 40 μm. *P < 0.05, P < 0.0005, ††P < 0.00005.
Figure 8
Figure 8. Amelioration of LDS vascular pathology by losartan treatment correlates with inhibition of pSmad2 and decreased expression of TGF-β ligand.
(A) Representative images of pSmad2, pERK1/2, CD45, and smooth muscle myosin heavy chain (SMMHC) staining in the aortic roots of 24-week-old Tgfbr2G357W/+ and control mice treated with placebo, propranolol or losartan. Images were acquired as a tile with a ×25 magnification. Scale bar: 100 μm. (B) Expression of Tgfb1, Col1a1, and Serpine1 in aortic root samples from 24-week-old Tgfbr2G357W/+ and control mice treated with placebo (Pla) or losartan (Los) (n = 3). The upper and lower margins of the box define the 75th and 25th percentiles, respectively; the internal line defines the median, and the whiskers define the range. *P < 0.05.

Comment in

Similar articles

Cited by

References

    1. Loeys BL, et al. A syndrome of altered cardiovascular, craniofacial, neurocognitive and skeletal development caused by mutations in TGFBR1 or TGFBR2. Nat Genet. 2005;37(3):275–281. doi: 10.1038/ng1511. - DOI - PubMed
    1. Loeys BL, et al. Aneurysm syndromes caused by mutations in the TGF-beta receptor. N Engl J Med. 2006;355(8):788–798. doi: 10.1056/NEJMoa055695. - DOI - PubMed
    1. Mizuguchi T, et al. Heterozygous TGFBR2 mutations in Marfan syndrome. Nat Genet. 2004;36(8):855–860. doi: 10.1038/ng1392. - DOI - PMC - PubMed
    1. Horbelt D, Guo G, Robinson PN, Knaus P. Quantitative analysis of TGFBR2 mutations in Marfan-syndrome-related disorders suggests a correlation between phenotypic severity and Smad signaling activity. J Cell Sci. 2010;123(pt 24):4340–4350. doi: 10.1242/jcs.074773. - DOI - PubMed
    1. Shi Y, Massague J. Mechanisms of TGF-β signaling from cell membrane to the nucleus. Cell. 2003;113(6):685–700. doi: 10.1016/S0092-8674(03)00432-X. - DOI - PubMed

Publication types

MeSH terms

Substances