. 2014 Feb;4(2):232-45.
doi: 10.1158/2159-8290.CD-13-0286. Epub 2013 Dec 19.

Molecular profiling of the residual disease of triple-negative breast cancers after neoadjuvant chemotherapy identifies actionable therapeutic targets

Affiliations

Molecular profiling of the residual disease of triple-negative breast cancers after neoadjuvant chemotherapy identifies actionable therapeutic targets

Justin M Balko et al. Cancer Discov. 2014 Feb.

Abstract

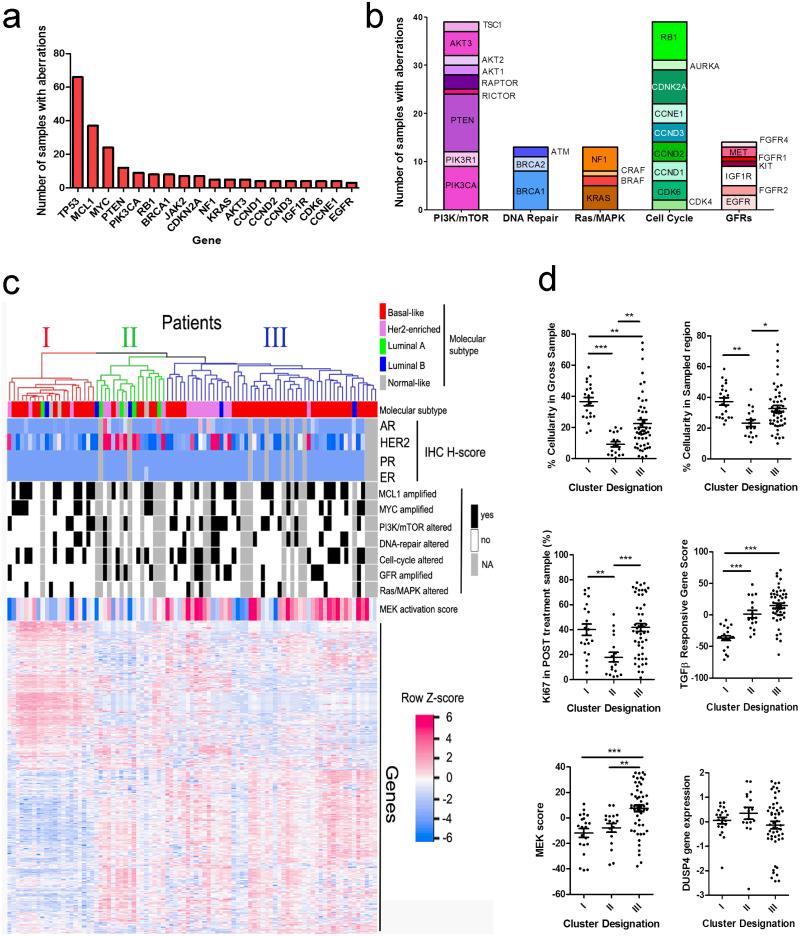
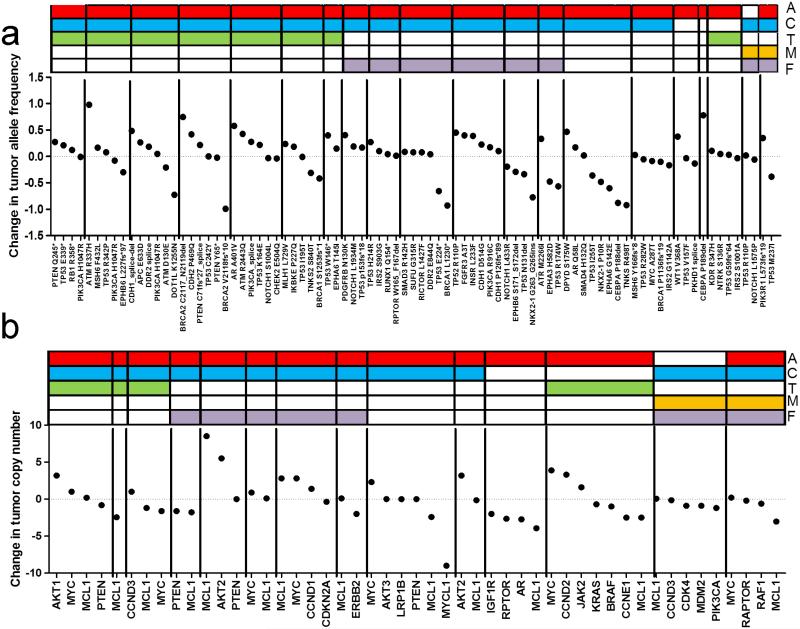
Neoadjuvant chemotherapy (NAC) induces a pathologic complete response (pCR) in approximately 30% of patients with triple-negative breast cancers (TNBC). In patients lacking a pCR, NAC selects a subpopulation of chemotherapy-resistant tumor cells. To understand the molecular underpinnings driving treatment-resistant TNBCs, we performed comprehensive molecular analyses on the residual disease of 74 clinically defined TNBCs after NAC, including next-generation sequencing (NGS) on 20 matched pretreatment biopsies. Combined NGS and digital RNA expression analysis identified diverse molecular lesions and pathway activation in drug-resistant tumor cells. Ninety percent of the tumors contained a genetic alteration potentially treatable with a currently available targeted therapy. Thus, profiling residual TNBCs after NAC identifies targetable molecular lesions in the chemotherapy-resistant component of the tumor, which may mirror micrometastases destined to recur clinically. These data can guide biomarker-driven adjuvant studies targeting these micrometastases to improve the outcome of patients with TNBC who do not respond completely to NAC.

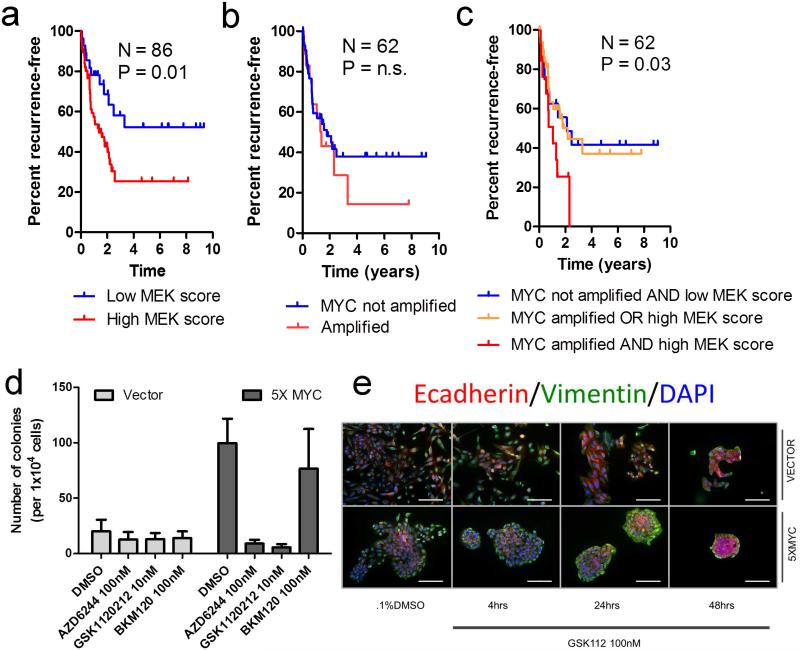
Significance: This study demonstrates the spectrum of genomic alterations present in residual TNBC after NAC. Because TNBCs that do not achieve a CR after NAC are likely to recur as metastatic disease at variable times after surgery, these alterations may guide the selection of targeted therapies immediately after mastectomy before these metastases become evident.


Figures

Figure 1
Figure 1. Targetable alterations and pathways in TNBCs after NAC
A) Most common recurrently altered genes detected by NGS, representing amplifications, deletions, rearrangements and known somatic mutations. B) Organization and representation of altered genes (n=81 tumors) into 5 functional and targetable pathways. A total of 118 genomic alterations were identified across 81 tumors (1.5 alterations/tumor). C) Integrated molecular analysis of residual tumors, using unsupervised clustering based on gene expression patterns (NanoString). D) Scatterplots depicting the differences among the clusters identified in (C) for cellularity in the entire FFPE block cross section; cellularity in the sampled (macro-dissected) hotspot; Ki67 score; TGF-β response signature; MEK signature; and DUSP4 gene expression. *p<0.05; ** p<0.01; ***p<0.001.
Figure 2
Figure 2. Quantitative changes in gene alterations in TNBC tumor pairs before and after NAC
A) Change in allele frequency of known and likely somatic mutations during NAC, adjusted for tumor purity assessment. Each segment (n=20) represents a patient. Type of neoadjuvant chemotherapy is depicted with a different color at the top; A: Adriamycin, C: cyclophosphamide, T: taxane, M: methotrexate, F: fluorouracil. B) Change in copy-number during NAC, adjusted for tumor purity assessment.
Figure 3
Figure 3. Co-amplification and interaction of MYC and MCL1 in TNBCs
A) MCL-1 IHC score as quantified on TMAs of TNBCs after NAC. Signal intensity (a.u: arbitrary units) was normalized for tumor area and number of nuclei. FBXW7-mutant patients are shown as green triangles. B) Example images of high and low MCL-1 expressing tumors by IHC. C) Co-amplification of MCL1 and MYC in residual breast tumors assessed in this study. Absolute numbers of tumors are shown in bars (p=0.001, Fisher’s exact test). D) Co-amplification of MCL1 and MYC in primary basal-like breast tumors in the TCGA(13, 38). E) Western blot of MCF10A cells expressing pLX302-GFP (control) or pLX302-MCL-1 (V5-tagged) and pINDUCER22-MYC (HA tagged) ± doxycycline treatment. F) Soft agar colony formation assay of MCF10A cells in (E) ± doxycycline where indicated. G) Quantification of colonies from (F). Each bar represents the mean colony number of triplicate wells ± SD. H) siRNA knockdown of MYC and MCL-1 in HCC1143 (MYC-amplified, MCL1-gain), HCC1395 (MYC-amplified), and MDA-436 (MYC-amplified and MCL1-amplified) cells (13). I) Baseline viability (upper panels) and response to dose titration of 72 h of doxorubicin (lower panels) of cell lines after siRNA knockdown. Viability curves are shown as relative to siCONTROL, DMSO treated controls. J) Viability curves of cells transduced with MCL-1 or GFP control and treated for 48 h with a dose titration of doxorubicin. Viability was measured with CellTiter-Glo (Promega). K) Caspase cleavage in cells from (J) after 5 h doxorubicin at the indicated doses. Caspase 3/7 cleavage was measured with Caspase-Glo (Promega).
Figure 4
Figure 4. Interaction of MYC amplification with MEK pathway activity correlates with poor prognosis in TNBCs
A) Kaplan Meier (KM) analysis of RFS in patients with a high MEK transcriptional signature(16) (highest 66%) vs. all others (lowest 33%). B) KM analysis of RFS in MYC-amplified patients versus those with normal MYC copy number. C) Combined KM analysis of patients with a high MEK transcriptional signature and MYC amplification versus those with either or neither alteration. D) Quantification of 3-week soft agar colony formation assays using MCF10A cells stably-transduced with MYC (5X MYC) vs. vector control, plated in the presence or absence of a single dose of AZD6244/selumetinib, GSK1120212/trametinib or the pan-PI3K inhibitor BKM120 at the indicated concentrations. Bars represent the mean colony number ± SD of 3 replicates. E) Immunofluorescence of E-cadherin, vimentin and DAPI in cells from (D) grown on chamber slides and treated with 100 nM GSK1120212/trametinib. Scale bars represent 50 μm.

References

    1. Guarneri V, Broglio K, Kau SW, Cristofanilli M, Buzdar AU, Valero V, et al. Prognostic value of pathologic complete response after primary chemotherapy in relation to hormone receptor status and other factors. J Clin Oncol. 2006;24:1037–44. - PubMed
    1. Kuerer HM, Newman LA, Smith TL, Ames FC, Hunt KK, Dhingra K, et al. Clinical course of breast cancer patients with complete pathologic primary tumor and axillary lymph node response to doxorubicin-based neoadjuvant chemotherapy. J Clin Oncol. 1999;17:460–9. - PubMed
    1. Liedtke C, Mazouni C, Hess KR, Andre F, Tordai A, Mejia JA, et al. Response to neoadjuvant therapy and long-term survival in patients with triple-negative breast cancer. J Clin Oncol. 2008;26:1275–81. - PubMed
    1. Guarneri V, Piacentini F, Ficarra G, Frassoldati A, D'Amico R, Giovannelli S, et al. A prognostic model based on nodal status and Ki-67 predicts the risk of recurrence and death in breast cancer patients with residual disease after preoperative chemotherapy. Ann Oncol. 2009;20:1193–8. - PubMed
    1. Jones RL, Salter J, A'Hern R, Nerurkar A, Parton M, Reis-Filho JS, et al. The prognostic significance of Ki67 before and after neoadjuvant chemotherapy in breast cancer. Breast Cancer Res Treat. 2009;116:53–68. - PubMed

Publication types

MeSH terms

Substances