. 2014 Feb;25(4):532-47.
doi: 10.1091/mbc.E13-05-0286. Epub 2013 Dec 19.

SIRT1 gene expression upon genotoxic damage is regulated by APE1 through nCaRE-promoter elements

Affiliations

SIRT1 gene expression upon genotoxic damage is regulated by APE1 through nCaRE-promoter elements

Giulia Antoniali et al. Mol Biol Cell. 2014 Feb.

Abstract

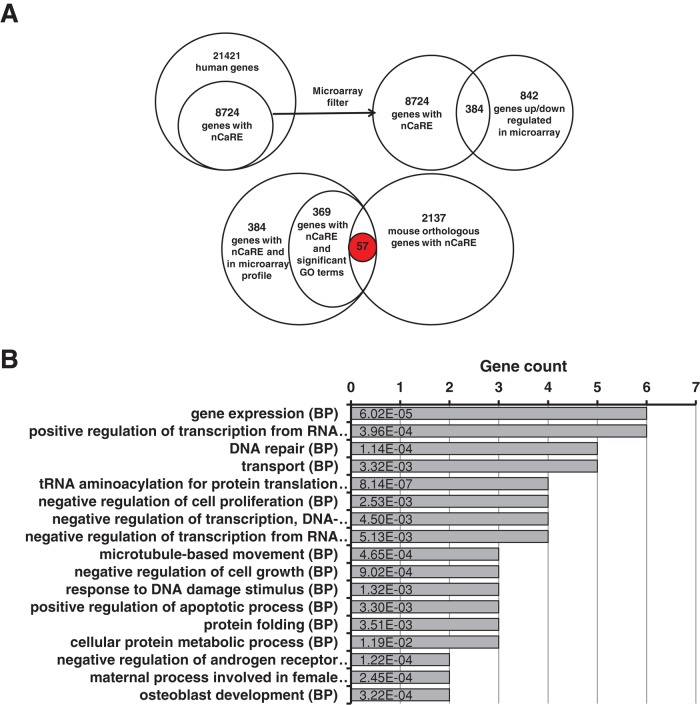
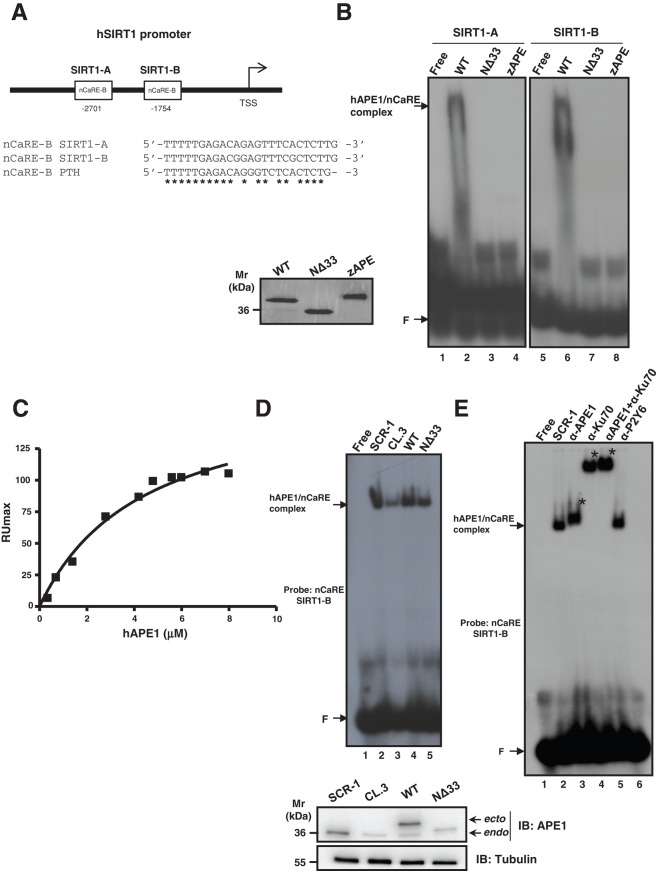
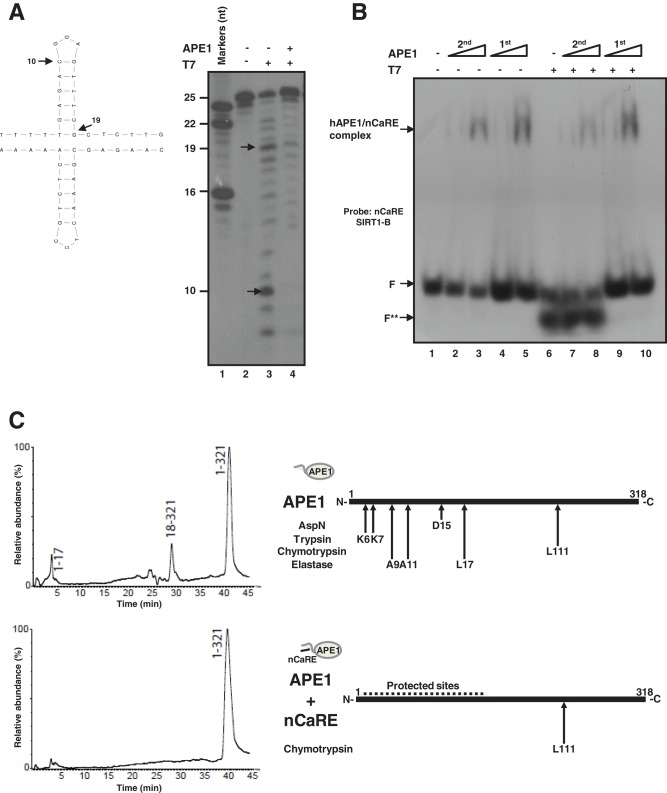
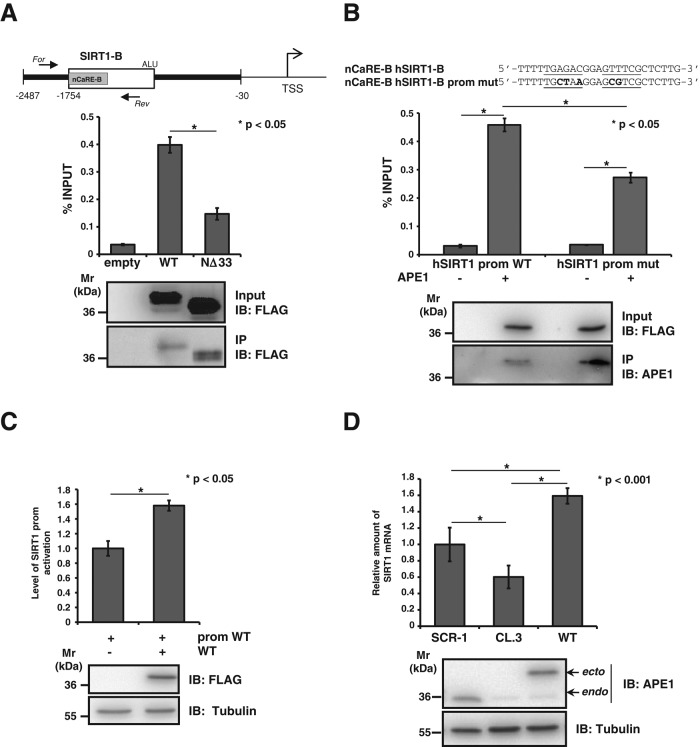
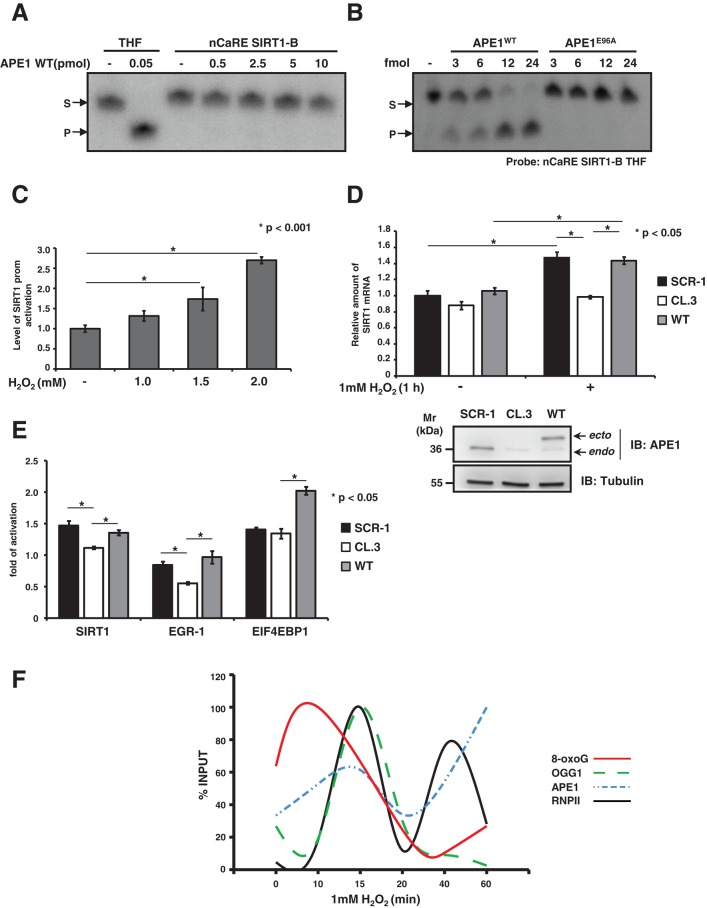
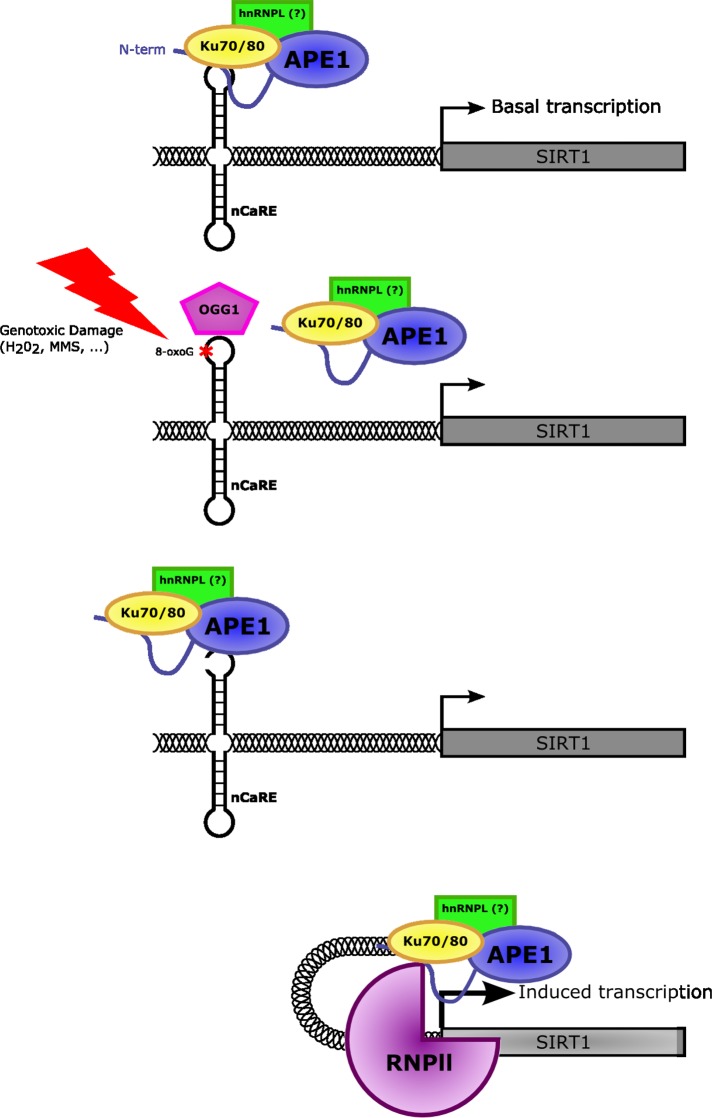
Apurinic/apyrimidinic endonuclease 1 (APE1) is a multifunctional protein contributing to genome stability via repair of DNA lesions via the base excision repair pathway. It also plays a role in gene expression regulation and RNA metabolism. Another, poorly characterized function is its ability to bind to negative calcium responsive elements (nCaRE) of some gene promoters. The presence of many functional nCaRE sequences regulating gene transcription can be envisioned, given their conservation within ALU repeats. To look for functional nCaRE sequences within the human genome, we performed bioinformatic analyses and identified 57 genes potentially regulated by APE1. We focused on sirtuin-1 (SIRT1) deacetylase due to its involvement in cell stress, including senescence, apoptosis, and tumorigenesis, and its role in the deacetylation of APE1 after genotoxic stress. The human SIRT1 promoter presents two nCaRE elements stably bound by APE1 through its N-terminus. We demonstrate that APE1 is part of a multiprotein complex including hOGG1, Ku70, and RNA Pol II, which is recruited on SIRT1 promoter to regulate SIRT1 gene functions during early response to oxidative stress. These findings provide new insights into the role of nCaRE sequences in the transcriptional regulation of mammalian genes.


Figures

FIGURE 1:
FIGURE 1:
Bioinformatic research on nCaRE sequences. (A) Results obtained from the application of the different filters. Top, data derived from alignment research on nCaRE sequences on human gene promoters and subsequent cross-checking with microarray data. Bottom, final results from combined GO and phylogenetic footprinting analyses. (B) Functional enrichment analysis of the 57 putative genes regulated by APE1 performed according to their biological process annotations. For simplicity, only the most representative functional categories are reported. The number of genes for each category is provided on the horizontal axis, together with the list of the first 17 co-occurrence terms. Statistical significance for each category is shown within each bar.
FIGURE 2:
FIGURE 2:
APE1 is part of a nuclear protein complex that binds to the SIRT1 nCaRE sequence through its N-terminal domain. (A) Schematic representation (top) and multiple sequence alignment (bottom) of two nCaRE-B sequences found on the human SIRT1 gene promoter (SIRT1-A and SIRT1-B) with the nCaRE sequence found on the human PTH promoter (Okazaki et al., 1991). (B) EMSA analysis of nCaRE SIRT1-A and SIRT1-B sequence challenged with 10 pmol of purified APE1WT, APE1NΔ33, and zAPE1 proteins. Left, Coomassie staining of the purified recombinant proteins. (C) SPR analysis of the human APE1 (hAPE1)–nCaRE interaction. Recombinant hAPE1 and biotinylated nCaRE SIRT1-B (Table 1) were used as analyte and ligand, respectively. Plot of RUmax from each binding vs. hAPE1 concentrations (0.5–8 μM); data were fitted by nonlinear regression analysis. (D) Top, EMSA analysis of nCaRE SIRT1-B incubated with HeLa nuclear extract of different clones: control clone, APE1SCR-1 (lane 2), clone silenced for APE1, APE1CL.3 (lane 3), and clones reconstituted with APE1WT (lane 4) or APE1NΔ33 (lane 5). Bottom, Western blot analysis of APE1 protein in HeLa nuclear cell extracts. (E) EMSA analysis of nCaRE SIRT1-B with HeLa nuclear extract from APE1SCR-1 clone alone (lane 2) or preincubated with monoclonal antibody against APE1 (lane 3) or/and with an antibody against Ku-70 (lanes 4 and 5). Lane 6 corresponds to APE1SCR-1 nuclear extract incubated with a nonspecific antibody (α-P2Y6). Free indicates probe alone; F shows the position of the free oligonucleotide probe. Specific APE1/nCaRE interaction is indicated by the arrow. Asterisk indicates supershift.
FIGURE 3:
FIGURE 3:
APE1 recognizes structured nCaRE sequences through its N-terminal domain. (A) Left, predicted cruciform structure of nCaRE SIRT1-B ds oligonucleotide. Arrows indicate the cleavage site of T7 endonuclease I and the length of the products. Right, 5′-32P-end-labeled nCaRE was preincubated (lane 4) or not (lane 3) with APE1 recombinant protein and then subject to T7 endonuclease digestion. (B) EMSA analysis of APE1 binding to nCaRE sequence after digestion with T7 endonuclease (lanes 7 and 8) or upon preincubation with APE1 and subsequent digestion with T7 endonuclease (lanes 9 and 10). Lane 1 is the probe alone; APE1 incubation with the probe was performed temporally before (1st) or after (2nd) T7 digestion; F shows the position of the free oligonucleotide probe. F** indicates the T7 endonuclease–digested probe. Specific APE1/nCaRE interaction is indicated by the arrow. (C) Schematic representation of the amino acids within the N-terminal domain of APE1 and involved in nCaRE oligonucleotide binding. Left, proteolytic maps obtained after incubation of recombinant APE1 alone (top) or recombinant APE1 complexed with SIRT1 nCaRE-B oligonucleotide (bottom) with endoprotease AspN. Experiments were performed on a recombinant APE1 form bearing three additional amino acids at the protein N-terminus with respect to the native counterpart. Peptides identified by mass spectrometry analysis are indicated at the top of the corresponding chromatographic peaks. Right, proteolytic sites identified in native APE1 alone (top) and in APE1 complexed with SIRT1 nCaRE-B oligonucleotide (bottom); summary of results from independent experiments performed by using different proteases. See the Supplemental Information for experimental details and Supplemental Figure S4 and Supplemental Table S4 for complete data.
FIGURE 4:
FIGURE 4:
APE1 positively regulates SIRT1 expression at the promoter level. (A). Top, schematic representation of the human SIRT1 promoter used for HeLa transfection. For and Rev arrows indicated the reverse transcription-PCR primer designed for the quantification of the human SIRT1 nCaRE sequence bound to APE1. Bottom, ChIP assay for APE1-nCaRE sequence association. Percentage of immunoprecipitated nCaRE DNA relative to that present in total input chromatin. Data were further normalized to the amount of immunoprecipitated protein. Western blot analysis was performed on total cell extracts (input) and immunoprecipitated material (IP) with specific antibody for FLAG and APE1. IB, immunoblot. (B) ChIP analysis on mutated human SIRT1 promoter. Top, base composition of the nCaRE SIRT1-B mutated sequence used for site-directed mutagenesis of SIRT1 promoter. Divergent sequences in the mutant nCaRE are bold. Bottom, HeLa cells were cotransfected with vector expressing APE1WT and, alternatively, wild-type or mutated hSIRT1 promoter. The histogram represents the amount of hSIRT1 promoter sequence that was immunoprecipitated. Data are percentage of input and are normalized to the amount of APE1 immunoprecipitated, as evaluated by Western blot analysis. (C) hSIRT1 promoter is activated in presence of APE1, as shown in the reporter assay. Western blot analysis showing the normalization of protein levels. (D) Analysis of SIRT1 mRNA level with qPCR in clones expressing APE1WT or APE1 silenced (CL.3) cells. Western blot analysis on protein extract of clones showing the suppression of endogenous APE1 expression upon 10 d of treatment with doxycycline.
FIGURE 5:
FIGURE 5:
Recruitment of BER enzymes on the SIRT1 promoter. (A) APE1 endonuclease activity on ds, nCaRE SIRT1-B radiolabeled oligonucleotide. A radiolabeled ds, THF-containing deoxyoligonucleotide (THF) was used as control. Reactions were performed with increasing amounts (picomoles) of recombinant APE1WT protein. (B) APE1 AP endonuclease activity on nCaRE SIRT1-B THF-containing probe incubated with increasing amounts of recombinant APE1WT protein or a catalytic inactive APE1 mutant (APE1E96A). (C) Reporter assay with HeLa cells transfected with hSIRT1 firefly reporter vector and challenged with increasing doses of H2O2 for 1 h as indicated. (D) qPCR analysis of SIRT1 mRNA levels in clones expressing APE1WT or APE1-silenced cells APE1CL.3 after 1 mM H2O2 treatment for 1 h. Western blot analysis on the protein extracts. (E) qPCR analysis of SIRT1, EGR-1, and EIF4EBP mRNA levels in APE1CL.3 or APE1WT clones after 1 mM H2O2 treatment for 1 h. Data shown are reported as fold of activation after H2O2 treatment. (F) Results of four independent ChIP analyses relative to accumulation of 8-oxodeoxyguanine, OGG1, APE1, and RNA polymerase II protein on the SIRT1 promoter after 1 mM H2O2 treatment for different times (as reported). Data are percentage of input and normalized to quantity of DNA immunoprecipitated by α-tubulin (α-tub). See Supplemental Figure S4 for detailed information.
FIGURE 6:
FIGURE 6:
Mechanistic model for the role of APE1 in oxidatively mediated SIRT1 transcription. Under normal conditions, APE1, together with other protein factors, is bound to the nCaRE element present within the SIRT1 promoter involved in the basal activation of SIRT1 transcription. Conversely, upon oxidative stress conditions, DNA oxidation determines the formation of 8-oxodeoxyguanine (8-oxoG) lesions at the nCaRE sequence present in the SIRT1 promoter, which are recognized and processed by BER enzymes, including APE1. The nicks introduced at the chromatin level by APE1 during 8-oxoG removal might promote the formation of chromatin loops moving the active form of RNA polymerase II closer to the TSS of the gene, turning on the transcription.

References

    1. Adelmant G, et al. DNA ends alter the molecular composition and localization of Ku multicomponent complexes. Mol Cell Proteomics. 2012;11:411–421. - PMC - PubMed
    1. Altschul SF. Amino acid substitution matrices from an information theoretic perspective. J Mol Biol. 1991;219:555–565. - PMC - PubMed
    1. Alvarez D, Novac O, Callejo M, Ruiz MT, Price GB, Zannis-Hadjopoulos M. 14-3-3sigma is a cruciform DNA binding protein and associates in vivo with origins of DNA replication. J Cell Biochem. 2002;87:194–207. - PubMed
    1. Amente S, Bertoni A, Morano A, Lania L, Avvedimento EV, Majello B. LSD1-mediated demethylation of histone H3 lysine 4 triggers Myc-induced transcription. Oncogene. 2010;29:3691–3702. - PubMed
    1. Barnes T, Kim W, Mantha AK, Kim S, Izumi T, Mitra S, Lee CH. Identification of Apurinic/apyrimidinic endonuclease 1 (APE1) as the endoribonuclease that cleaves c-myc mRNA. Nucleic Acids Res. 2009;37:3946–3958. - PMC - PubMed

Publication types

MeSH terms

LinkOut - more resources