. 2014 Feb;25(4):470-80.
doi: 10.1091/mbc.E13-06-0331. Epub 2013 Dec 19.

A novel human aquaporin-4 splice variant exhibits a dominant-negative activity: a new mechanism to regulate water permeability

Affiliations

A novel human aquaporin-4 splice variant exhibits a dominant-negative activity: a new mechanism to regulate water permeability

Manuela De Bellis et al. Mol Biol Cell. 2014 Feb.

Abstract

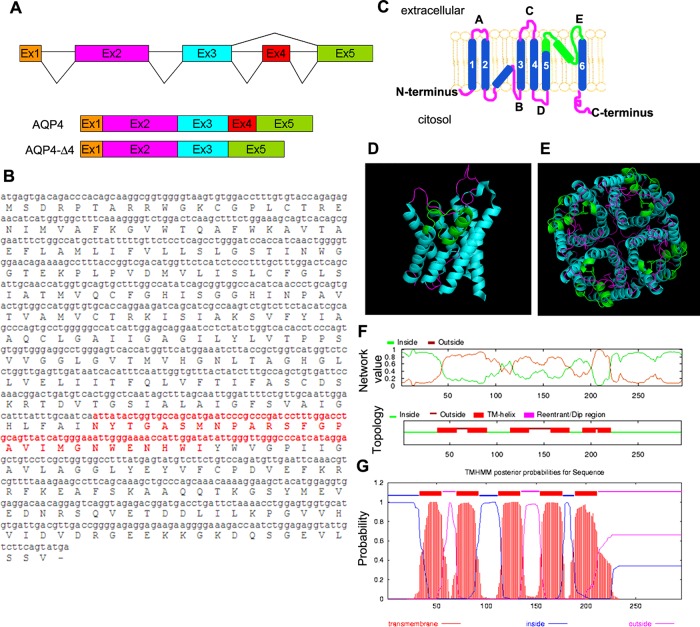
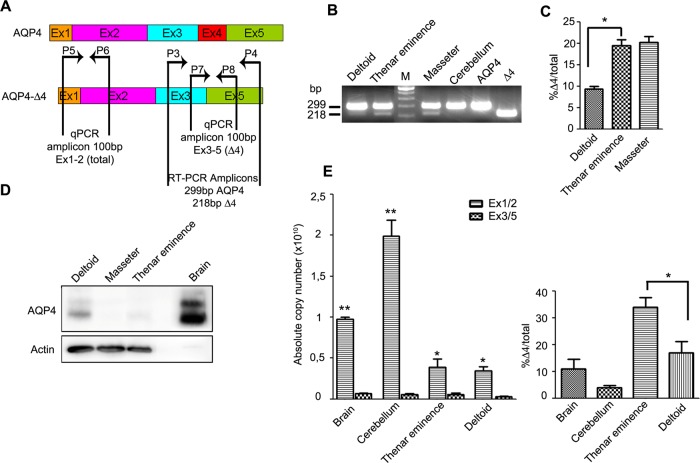
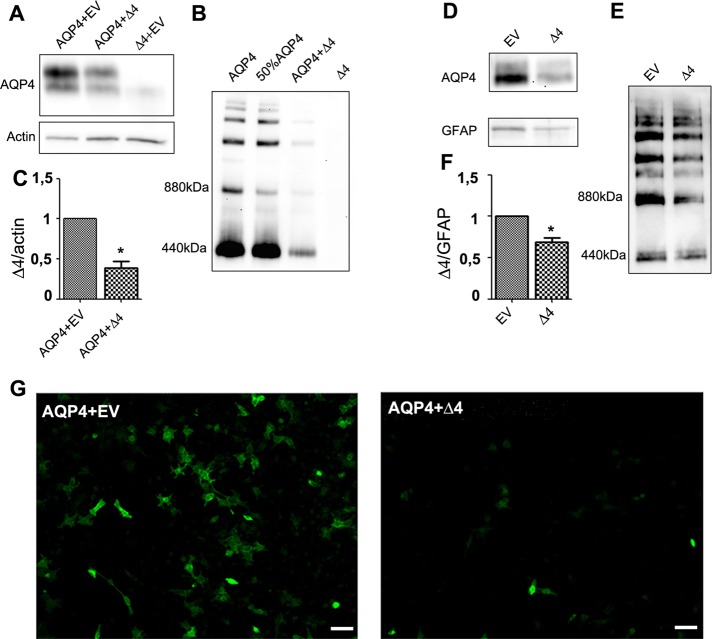
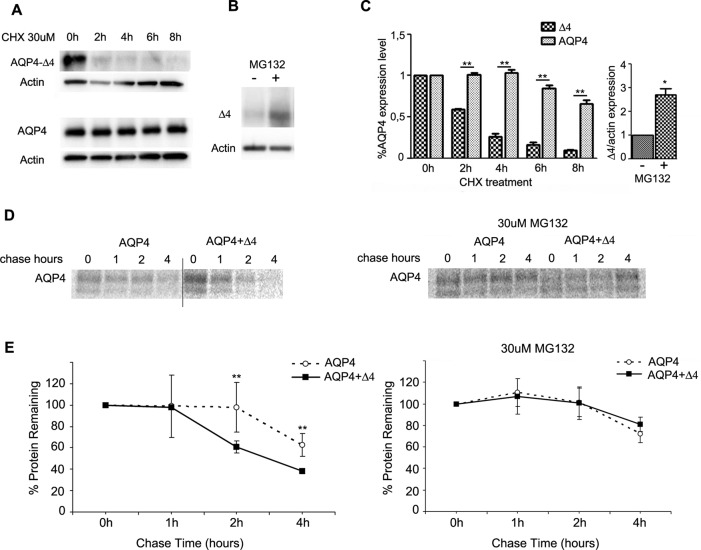
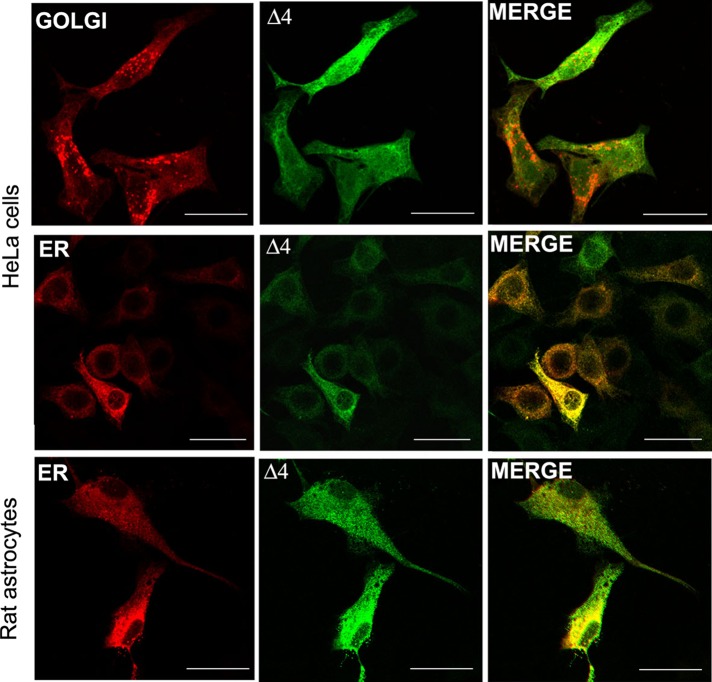
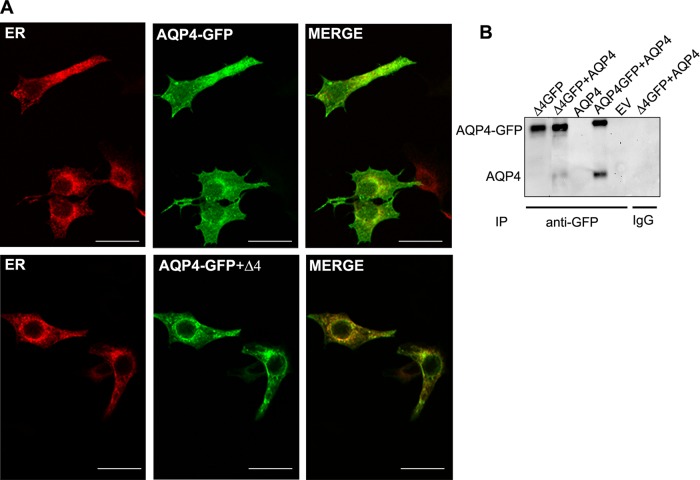
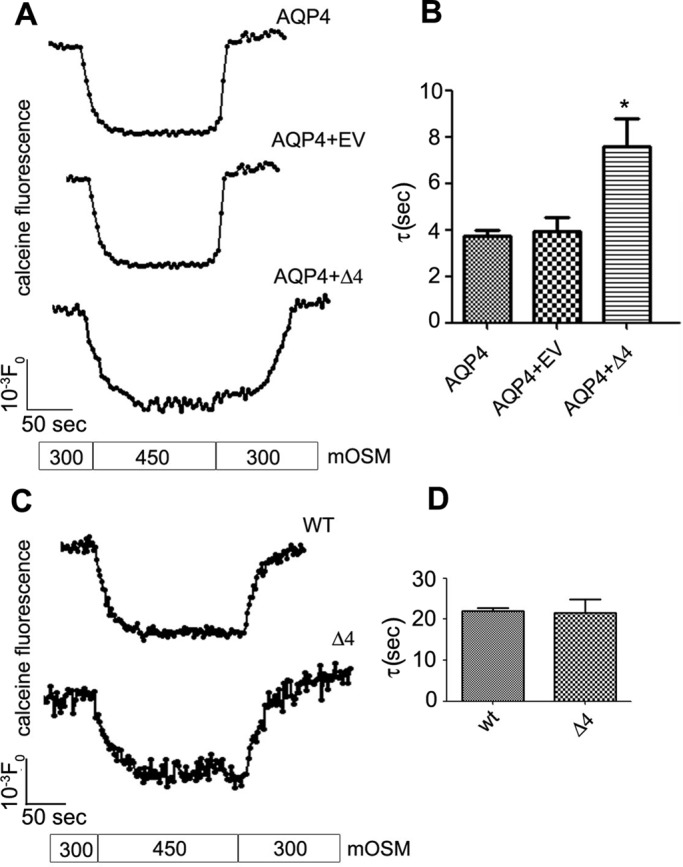
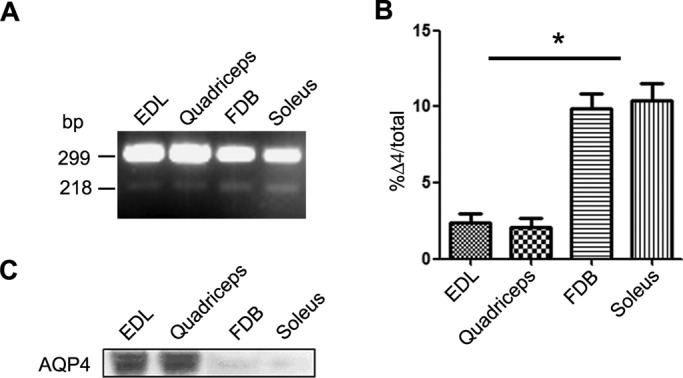
Two major isoforms of aquaporin-4 (AQP4) have been described in human tissue. Here we report the identification and functional analysis of an alternatively spliced transcript of human AQP4, AQP4-Δ4, that lacks exon 4. In transfected cells AQP4-Δ4 is mainly retained in the endoplasmic reticulum and shows no water transport properties. When AQP4-Δ4 is transfected into cells stably expressing functional AQP4, the surface expression of the full-length protein is reduced. Furthermore, the water transport activity of the cotransfectants is diminished in comparison to transfectants expressing only AQP4. The observed down-regulation of both the expression and water channel activity of AQP4 is likely to originate from a dominant-negative effect caused by heterodimerization between AQP4 and AQP4-Δ4, which was detected in coimmunoprecipitation studies. In skeletal muscles, AQP4-Δ4 mRNA expression inversely correlates with the level of AQP4 protein and is physiologically associated with different types of skeletal muscles. The expression of AQP4-Δ4 may represent a new regulatory mechanism through which the cell-surface expression and therefore the activity of AQP4 can be physiologically modulated.


Figures

FIGURE 1:
FIGURE 1:
Characteristics of the alternatively spliced transcript of human AQP4. (A) Schematic representation of the human AQP4 gene (top), the normally spliced AQP4 isoform (middle), and the exon-skipped AQP4-Δ4 isoform (bottom). The exons are shown as boxes, and their relative sizes are depicted; alternative splicing patterns are indicated as lines connecting the exons. (B) Nucleotide and amino acid (capital letters) sequences of AQP4. The alternatively spliced exon 4 and the related 27 deleted amino acids are shown in red. (C) Transmembrane topology of AQP4 showing relative orientation of N- and C-termini, transmembrane segments (numbers), and loops (capital letters). The deleted portion is indicated in green. (D, E) Location of deleted portion (green) in AQP4 monomer (D) and AQP4 tetramer (E) in structural models designed using PyMOL software (De Lano Scientific). (F, G) Topological prediction of AQP4-Δ4 with predicted transmembrane regions and probability graphs by TMHMM (www.cbs.dtu.dk/services/TMHMM/) and (G) OCTOPUS (http://octopus.cbr.su.se/).
FIGURE 2:
FIGURE 2:
Expression of AQP4 transcripts and protein in human tissue. (A) Primers used for RT-PCR and qPCR with their relative location in AQP4 and AQP4-Δ4 mRNA. (B) Coamplification by RT-PCR of AQP4 splice variant with full-length AQP4 from four different human cDNAs. Two bands are visible in skeletal muscles. No AQP4-Δ4 amplicon was detected in human cerebellum. (C) Histogram showing percentage of AQP4-Δ4 (Δ4) relative to the total measured by RT-PCR (*p = 0.03, n = 3). (D) Immunoblot detection of AQP4 protein expressed in human brain and skeletal muscle. Two bands of 32 and 30 kDa were detected corresponding, respectively, to M1 and M23. Actin was used as a loading control. (E) qPCR analysis showing absolute quantities of AQP4 and AQP4-Δ4 mRNA (left) and the ratio between the two forms (right) in human tissue using isoform-specific primers (*p < 0.05, n = 4; **p < 0.01, n = 4).
FIGURE 3:
FIGURE 3:
Dominant-negative effect of AQP4-Δ4 in mammalian cells. (A, B) Immunoblot analysis of AQP4 expression in HeLa cells cotransfected with AQP4 and AQP4-D4 (D4), both cloned into pTARGET or empty vector (EV). Protein samples were analyzed by SDS–PAGE (A) or blue native PAGE (BN-PAGE; B). (C) Densitometric analysis reported as AQP4/actin expression ratio. The histogram shows the analysis of five independent experiments (*p < 0.05). (D, E) AQP4 expression in rat primary astrocyte cultures transfected with deleted isoform, cloned into pTARGET mammalian expression vector or empty vector, and analyzed by SDS–PAGE (D) or BN-PAGE (E). The multiple bands detected after BN-PAGE (B, D) correspond to supramolecular organization (i.e., OAPs) of AQP4. (F) Histogram for the densitometric analysis of the protein bands in D, calculated as AQP4/GFAP expression ratio. Analysis of three independent experiments (*p < 0.05). (G) Immunofluorescence AQP4 staining in HeLa cells cotransfected with AQP4 and empty vector (EV) or AQP4 and AQP4-D4 in a 1:1 ratio. Scale bar, 50 μm. Images are representative of six independent experiments.
FIGURE 4:
FIGURE 4:
AQP4-Δ4 protein stability and dominant-negative effect. (A) Immunoblot analysis of AQP4 expression in HeLa cells transfected with AQP4 or AQP4-Δ4 and treated with 30 μM CHX for the indicated duration to stop protein synthesis. (B) Immunoblot analysis of AQP4-Δ4 (Δ4) levels in transiently transfected HeLa cells treated or not with 15 μM MG132 proteasome inhibitor (MG132 ±). (C) Histograms for the densitometric analysis of the AQP4 expression levels obtained after CHX treatment (left; mean ± SE; **p < 0.01; n = 3–5 independent experiments) or MG132 treatment (right; n = 3 or 4 independent experiments; *p < 0.05). (D) HeLa cells transiently transfected with AQP4 alone or in the presence of dominant-negative AQP4-D4 were labeled for 30 min with [35S]cysteine/methionine and chased for the indicated times. Cells were then solubilized, and lysates were immunoprecipitated with anti-AQP4 antibody and analyzed by autoradiography as described in Materials and Methods. Where indicated, transfected HeLa cells were pretreated with 30 μM proteasome inhibitor MG132 for 3 h before starvation, and proteasome inhibitor was maintained throughout the experiments. (D) Representative autoradiograms of immunoprecipitated proteins with chase times of 0, 1, 2, and 4 h. (E) Averaged kinetics of protein degradation from four independent sets of experiments (mean ± SE; **p < 0.01).
FIGURE 5:
FIGURE 5:
AQP4-Δ4 protein subcellular localization. Confocal image of localization of AQP4-Δ4 (Δ4, green) in transfected HeLa cells and rat astrocyte primary cultures using subcellular markers (red). Note the colocalization of the spliced isoform with ER in both cell types. Images are representative of six independent experiments. Scale bar, 15 μm.
FIGURE 6:
FIGURE 6:
AQP4 WT is retained in ER when coexpressed with AQP4-Δ4. (A) Confocal images of full-length AQP4 and AQP4-Δ4 (green) with ER marker (red). Note that full-length AQP4 in the presence of the spliced isoform (Δ4) is strongly retained in the ER compartment (bottom). Images are representative of four independent experiments. Scale bar, 15 μm. (B) Immunoblot of anti-GFP precipitated proteins revealed with anti-AQP4 antibodies. HeLa cells were cotransfected with the indicated expression constructs and treated for 7 h with 15 μM proteasome inhibitor MG132 to prolong AQP4-Δ4 half-life; immunoprecipitation with agarose beads was performed using anti-GFP (anti-GFP) or rabbit (immunoglobulin G) antibodies. The top band corresponds to AQP4-GFP, and the bottom band corresponds to AQP4 without a tag. Note the presence of AQP4 in the second lane. EV, empty vector.
FIGURE 7:
FIGURE 7:
Analysis of the effect of AQP4-Δ4 on cell water transport. (A) A stable cell line expressing a high level of AQP4 was transiently transfected with AQP4-Δ4 (Δ4), and after 36 h water transport analysis was performed using the calcein-quenching method after osmotic shock at 10°C. Top, time course of the stable cell line; middle, time course of the cell line transiently transfected with the control vector (EV); bottom, time course of cell expressing AQP4-Δ4 (Δ4). (B) Mean values ± SEM of the time constant (n = 3–5 independent experiments; *p < 0.05). (C) kinetics of fluorescent calcein of wild-type and AQP4-Δ4 (Δ4) stable cell lines. (D) Mean values ± SEM of the time constant (n = 3–5 independent experiments).
FIGURE 8:
FIGURE 8:
Expression of AQP4-Δ4 in rat skeletal muscle. (A) Coamplification by RT-PCR of AQP4 splice variant with full-length AQP4 from rat EDL, quadriceps, FDB, and soleus muscles and cerebellum. Note the two bands visible in skeletal muscles. (B) Densitometric analysis of AQP4-Δ4 abundance in different muscles (*p < 0.05; n = 3). (C) Immunoblot analysis of AQP4 expression in the analyzed rat tissues.

References

    1. Assentoft M, Kaptan S, Fenton RA, Hua SZ, de Groot BL, Macaulay N. Phosphorylation of rat aquaporin-4 at Ser(111) is not required for channel gating. Glia. 2013;61:1101–1112. - PubMed
    1. Basco D, Blaauw B, Pisani F, Sparaneo A, Nicchia GP, Mola MG, Reggiani C, Svelto M, Frigeri A. AQP4-dependent water transport plays a functional role in exercise-induced skeletal muscle adaptations. PLoS One. 2013;8:e58712. - PMC - PubMed
    1. Frigeri A, Gropper MA, Umenishi F, Kawashima M, Brown D, Verkman AS. Localization of MIWC and GLIP water channel homologs in neuromuscular, epithelial and glandular tissues. J Cell Sci. 1995;108:2993–3002. - PubMed
    1. Frigeri A, Nicchia GP, Nico B, Quondamatteo F, Herken R, Roncali L, Svelto M. Aquaporin-4 deficiency in skeletal muscle and brain of dystrophic mdx mice. FASEB J. 2001;15:90–98. - PubMed
    1. Frigeri A, Nicchia GP, Verbavatz JM, Valenti G, Svelto M. Expression of aquaporin-4 in fast-twitch fibers of mammalian skeletal muscle. J Clin Invest. 1998;102:695–703. - PMC - PubMed

Publication types

MeSH terms

LinkOut - more resources