. 2013 Dec 19;2(6):e000246.
doi: 10.1161/JAHA.113.000246.

Functional, anatomical, and molecular investigation of the cardiac conduction system and arrhythmogenic atrioventricular ring tissue in the rat heart

Affiliations

Functional, anatomical, and molecular investigation of the cardiac conduction system and arrhythmogenic atrioventricular ring tissue in the rat heart

Andrew J Atkinson et al. J Am Heart Assoc. .

Abstract

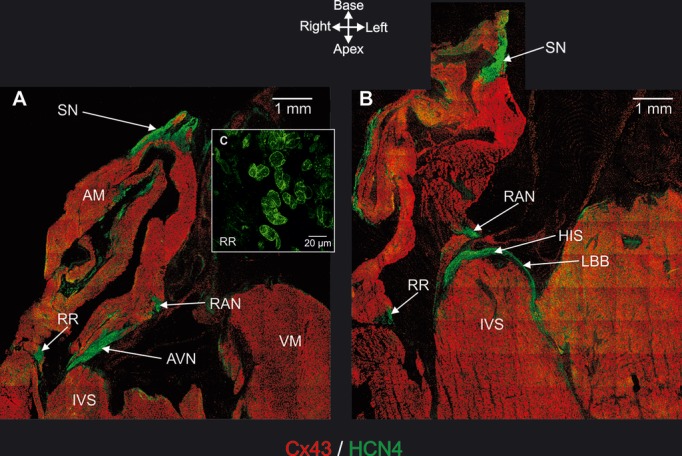
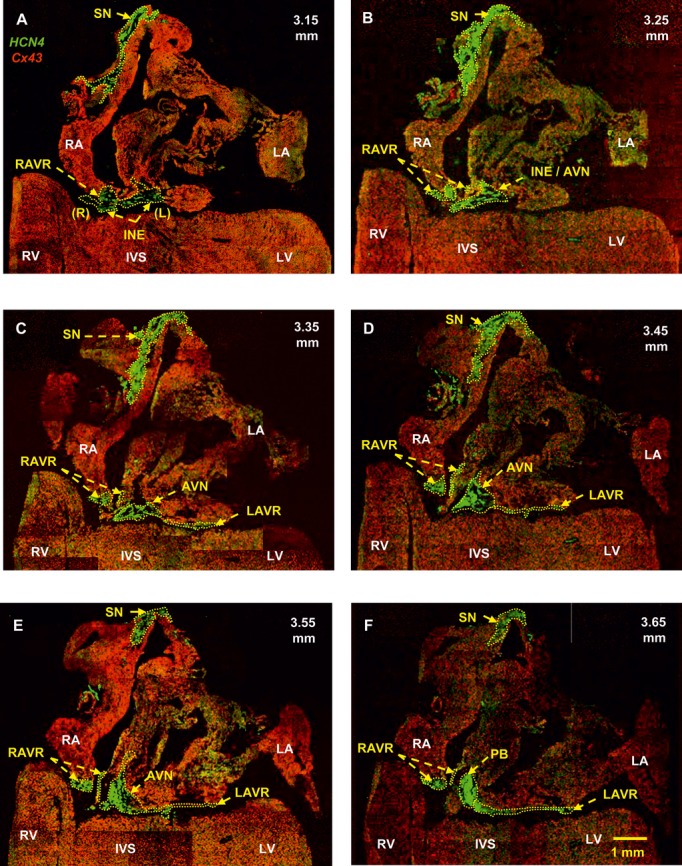
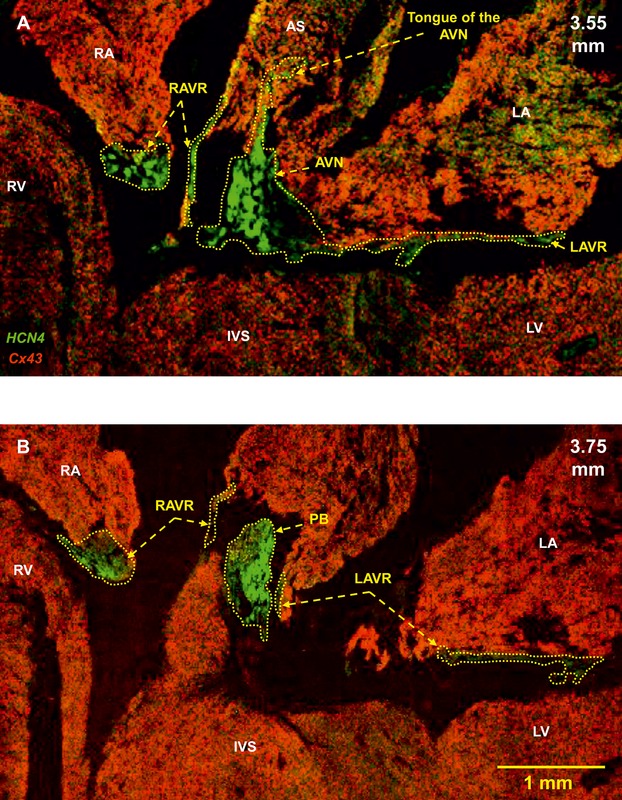
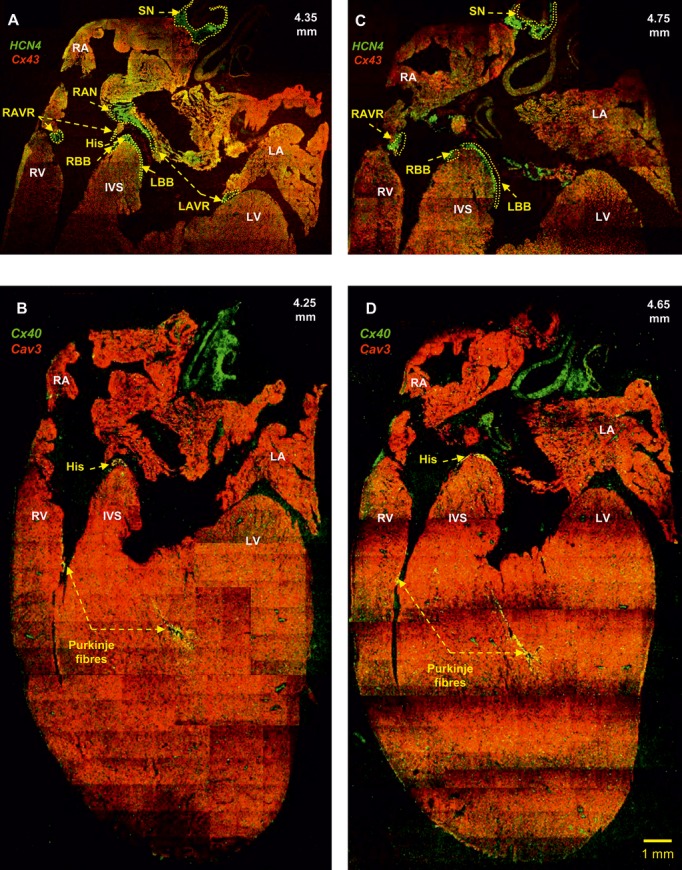
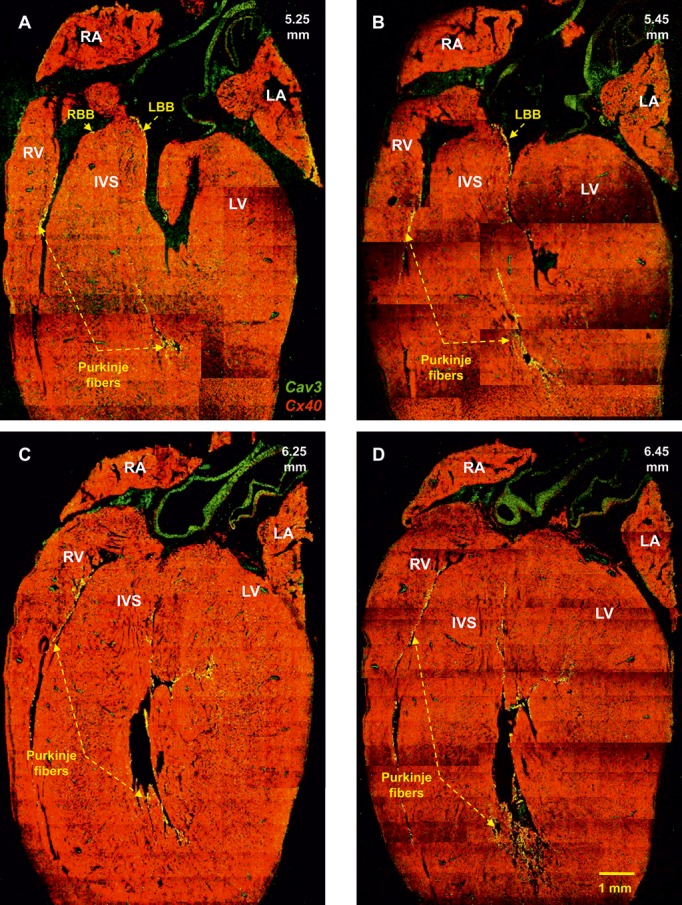
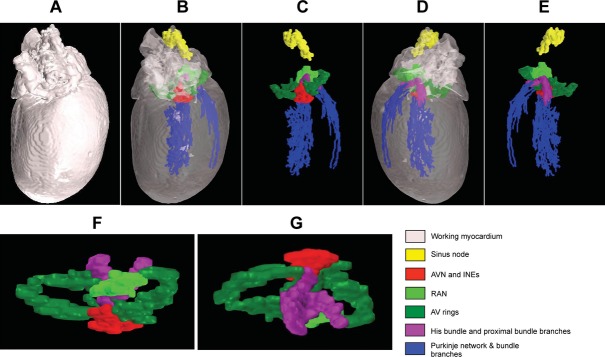
Background: The cardiac conduction system consists of the sinus node, nodal extensions, atrioventricular (AV) node, penetrating bundle, bundle branches, and Purkinje fibers. Node-like AV ring tissue also exists at the AV junctions, and the right and left rings unite at the retroaortic node. The study aims were to (1) construct a 3-dimensional anatomical model of the AV rings and retroaortic node, (2) map electrical activation in the right ring and study its action potential characteristics, and (3) examine gene expression in the right ring and retroaortic node.

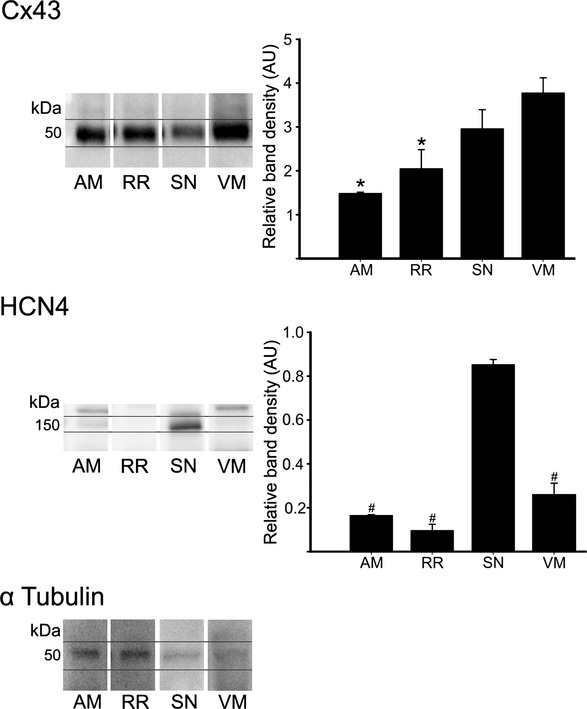
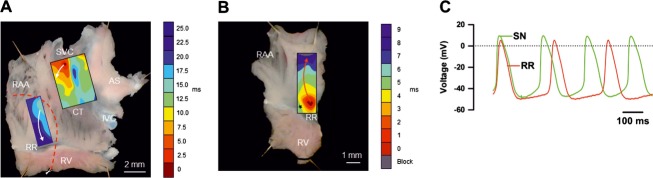
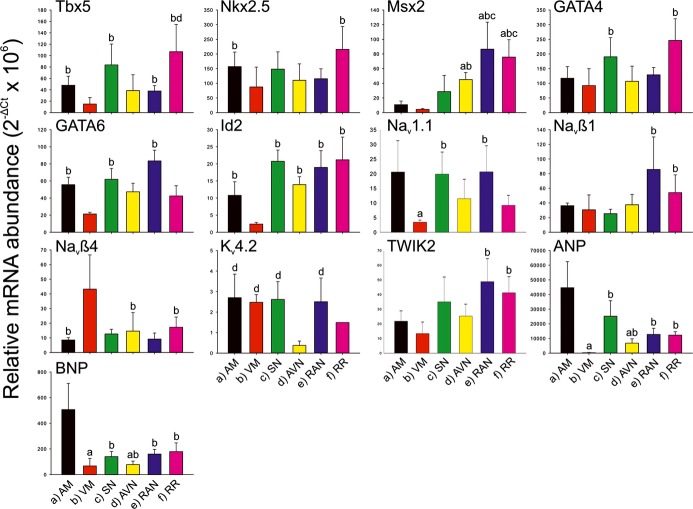
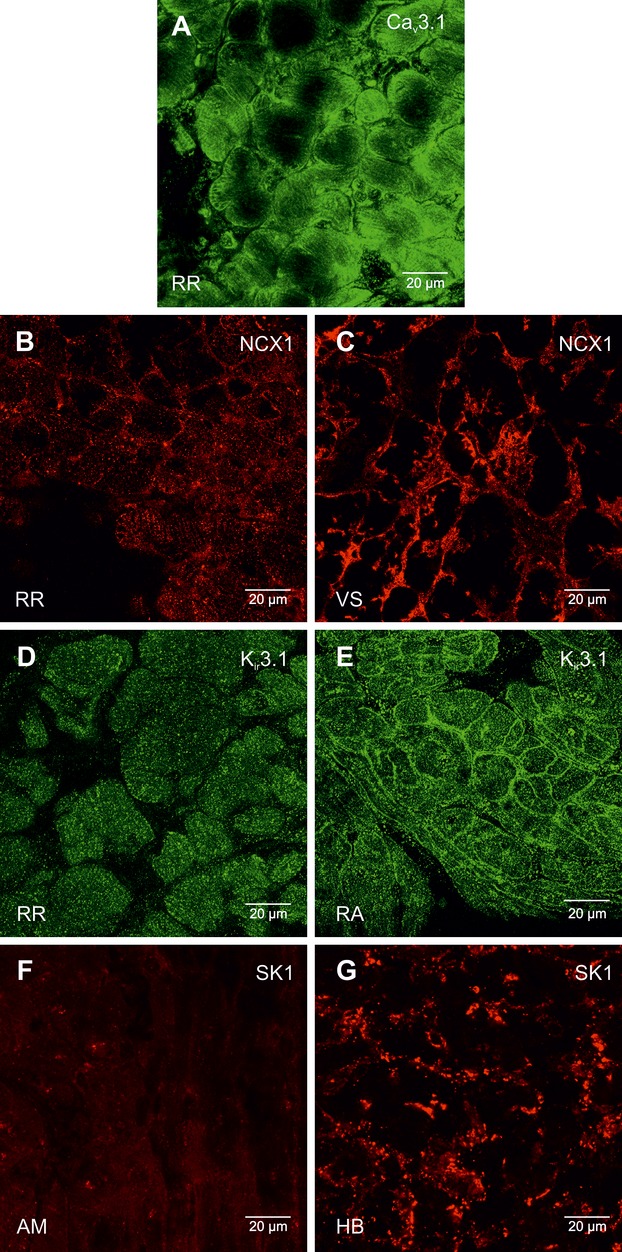
Methods and results: Three-dimensional reconstruction (based on magnetic resonance imaging, histology, and immunohistochemistry) showed the extent and organization of the specialized tissues (eg, how the AV rings form the right and left nodal extensions into the AV node). Multiextracellular electrode array and microelectrode mapping of isolated right ring preparations revealed robust spontaneous activity with characteristic diastolic depolarization. Using laser microdissection gene expression measured at the mRNA level (using quantitative PCR) and protein level (using immunohistochemistry and Western blotting) showed that the right ring and retroaortic node, like the sinus node and AV node but, unlike ventricular muscle, had statistically significant higher expression of key transcription factors (including Tbx3, Msx2, and Id2) and ion channels (including HCN4, Cav3.1, Cav3.2, Kv1.5, SK1, Kir3.1, and Kir3.4) and lower expression of other key ion channels (Nav1.5 and Kir2.1).

Conclusions: The AV rings and retroaortic node possess gene expression profiles similar to that of the AV node. Ion channel expression and electrophysiological recordings show the AV rings could act as ectopic pacemakers and a source of atrial tachycardia.

Keywords: action potential; arrhythmogenesis; atrioventricular ring tissues; cardiac conduction system; ion channels.


Figures

Figure 1.
Figure 1.
Flow diagram showing the steps used for 3‐dimensional (3D) reconstruction. A, Whole heart was sectioned and immunolabeled. B, Based on immunolabeling, the SN, AV rings, retroaortic node, AVN, penetrating or His bundle, bundle branches, and Purkinje fibers were delineated. C, Delineated structures were transferred onto the histological images. D, Delineated structures were transferred onto corresponding MR images. E, MR images with the delineated structures were imported in MATLAB and a 3D mathematical model constructed. AVN indicates atrioventricular node; MR, magnetic resonance; SN, sinus node.
Figure 2.
Figure 2.
Laser microdissection (LMD). A, HCN4 (green signal) immunolabeling to identify the atrioventricular node (AVN). The AVN corresponds to the crescent‐shaped area of bright green signal. B, Quick hematoxylin and eosin–stained adjacent section prior to LMD. C, Same section as in B after LMD of the AVN.
Figure 3.
Figure 3.
Immunohistochemical detection of AV rings and retroaortic node (and also principal tissues making up CCS). A and B, Long‐axis tissue sections immunolabeled for HCN4 (green signal) and Cx43 (red signal). Sections taken at level of AVN (A) and His bundle (B). C, High‐magnification image of HCN4 labeling in right ring. AM indicates atrial muscle; AVN, atrioventricular node; HIS, penetrating or His bundle; IVS, interventricular septum; LBB, left bundle branch; RAN, retroaortic node; RR, right ring; SN, sinus node; VM, ventricular muscle.
Figure 4.
Figure 4.
Western blot showing protein expression of Cx43 (top), HCN4 (middle), and α‐tubulin (bottom). Cx43 and HCN4 band density normalized to α‐tubulin presented in graphs. *P<0.05 vs VM; #P<0.05 vs SN. AM indicates atrial muscle; RR, right ring; SN, sinus node; VM, ventricular muscle.
Figure 5.
Figure 5.
Identification of the SN, AV rings, inferior nodal extensions, AVN, and penetrating bundle. Double labeling of HCN4 (green signal) and Cx43 (red signal) proteins in long‐axis sections at different levels through the heart is shown (distance in mm from the back to the front of the heart shown). A, Section at 3.15 mm showing that the right and left rings are continuous with the right and left nodal extensions. B, Section at 3.25 mm showing the transitional area between the nodal extension and the AVN. C, Section at 3.35 mm showing the SN, right and left rings, and AVN. D, Section at 3.45 mm showing the atrial component of the AVN. The left ring is continuous with the AVN. E, Section at 3.55 mm showing again that the left ring is continuous with the AVN. F, Section at 3.65 mm showing that the left ring is continuous with the penetrating bundle. AVN indicates atrioventricular node; INE, inferior nodal extension (right and left); IVS, interventricular septum; LA, left atrium; LAVR, left atrioventricular ring; LV, left ventricle; PB, penetrating bundle; RA, right atrium; RAVR, right atrioventricular ring; RV, right ventricle; SN, sinus node.
Figure 6.
Figure 6.
High‐magnification images of the AV rings, AVN, and penetrating bundle. Double labeling of HCN4 (green signal) and Cx43 (red signal) proteins in long‐axis sections at different levels through the heart is shown (distance in mm from the back to the front of the heart shown). A, Section at 3.55 mm showing the AVN with a tongue extending into the atrial septum. B, Section at 3.75 mm showing the penetrating bundle. Same heart as shown in Figure 5. AS indicates atrial septum; AVN, atrioventricular node; IVS, interventricular septum; LA, left atrium; LAVR, left atrioventricular ring; LV, left ventricle; PB, penetrating bundle; RA, right atrium; RAVR, right atrioventricular ring; RV, right ventricle.
Figure 7.
Figure 7.
Identification of the AV rings, retroaortic node, right and left bundle branches, and Purkinje fibers. A and C, Double labeling of HCN4 (green signal) and Cx43 (red signal) proteins in long‐axis sections at 4.35 and 4.75 mm (from the back to the front of the heart). The right and left rings can be seen to unite within the retroaortic node. B and D, Double labeling of Cx40 (green signal) and caveolin3 (red signal) proteins in long‐axis sections at 4.25 and 4.65 mm (from the back to the front of the heart) showing the penetrating bundle and the Purkinje fibers. Same heart as shown in Figure 5. His indicates bundle of His; IVS, interventricular septum; LA, left atrium; LAVR, left atrioventricular ring; LBB, left bundle branch; LV, left ventricle; RA, right atrium; RAVR, right atrioventricular ring; RAN, retroaortic node; RBB, right bundle branch; RV, right ventricle; SN, sinus node.
Figure 8.
Figure 8.
Identification of the right and left bundle branches and Purkinje fibres. Double labeling of Cx40 (green signal) and caveolin3 (red signal) proteins in long‐axis sections at 5.25 to 6.45 mm (from the back to the front of the heart) is shown. Same heart as shown in Figure 5. IVS indicates interventricular septum; LA, left atrium; LBB, left bundle branch; LV, left ventricle; RA, right atrium; RBB, right bundle branch; RV, right ventricle.
Figure 9.
Figure 9.
A three‐dimensional (3D) model of extended CCS. A, 3D model of heart (with opaque myocardium) viewed from dorsal surface. B, 3D model of heart (with transparent myocardium) viewed from dorsal surface. C, 3D model of extended CCS only (myocardium removed) viewed from dorsal surface. D, 3D model of heart (with transparent myocardium) viewed from ventral surface. E, 3D model of extended CCS only (myocardium removed) viewed from ventral surface. F and G, Top (F) and bottom (G) views of 3D model of AV rings, retroaortic node, and AV conduction axis. AVN indicates atrioventricular node; INEs, inferior nodal extensions; RAN, retroaortic node.
Figure 10.
Figure 10.
Pacemaker activity in right ring. A, Preparation of rear wall of right atrium containing SN and right ring. Boxes shows position of mapping arrays covering area of SN (8×8 extracellular electrodes) and right ring (6×10 extracellular electrodes). Leading pacemaker site (identified as site of earliest activation) located in SN, and anterograde conduction in right atrial free wall. Arrows show direction of AP conduction from SN to rest of preparation. To isolate right ring (as shown in B), tissue was cut along dashed line. B, Preparation containing right ring only (SN and AVN removed). Box shows position of mapping array (6×10 extracellular electrodes). Stars denotes pacemaker site in right ring and arrows show retrograde conduction from pacemaker site to remainder of right atrium. C, Typical intracellular action potentials recorded from pacemaker sites in right ring and SN. AS indicates atrial septum; CT, crista terminalis; IVC, inferior vena cava; RAA, right atrial appendage; RR, right ring; RV, right ventricle; SN, sinus node; SVC, superior vena cava.
Figure 11.
Figure 11.
Relative abundance of mRNA for markers, transcription factors and ion channels. Means of 2−∆Ct (+SEM) shown (AM, n=4; VM, n=4; SN, n=5; AVN, n=4; RAN, n=5; RR, n=4). a through f, Significant difference (FDR <0.2, P<0.05) from corresponding bar. AM indicates atrial muscle; AVN, atrioventricular node; FDR, false discovery rate; FITC, fluorescein isothiocyanate; HRP, horseradish peroxidase; RAN, retroaortic node; RR, right ring tissue; SN, sinus node; VM, ventricular muscle.
Figure 12.
Figure 12.
Relative abundance of mRNA for components of the extracellular matrix. Means of 2−∆Ct (+SEM) shown (AM, n=4; VM, n=4; SN, n=5; AVN, n=4; RAN, n=5; RR, n=4). A through F, Significant difference (FDR<0.2, P<0.05) from corresponding bar. AM indicates atrial muscle; ANP, atrial natriuretic peptide; AVN, atrioventricular node; BNP, brain natriuretic peptide; FDR, false discovery rate; RAN, retroaortic node; RR, right ring tissue; SN, sinus node; VM, ventricular muscle.
Figure 13.
Figure 13.
Relative abundance of mRNA for Tbx3 and ion channels underlying cardiac action potential. Means of 2−∆Ct (+SEM) shown (AM, n=4; VM, n=4; SN, n=5; AVN, n=4; RAN, n=5; RR, n=4). A through F, Significant difference (P<0.05, FDR<0.2) from corresponding bar. AM indicates atrial muscle; AVN, atrioventricular node; FDR, false discovery rate; MMP, matrix metalloproteinase; RAN, retroaortic node; RR, right ring; SN, sinus node; TGF, transforming growth factor; TIMP, tissue inhibitor of metalloproteinase; VM, ventricular muscle.
Figure 14.
Figure 14.
Relative abundance of mRNA for Na+–K+ pump, exchangers, Ca2+‐handling proteins, and connexins. Means of 2−∆Ct (+SEM) shown (AM, n=4; VM, n=4; SN, n=5; AVN, n=4; RAN, n=5; RR, n=4). A through F, Significant difference (P<0.05, FDR<0.2) from corresponding bar. AM indicates atrial muscle; AVN, atrioventricular node; FDR, false discovery rate; NCX1, Na+–Ca2+ exchanger; RAN, retroaortic node; RR, right ring; RYR, ryanodine receptor; SN, sinus node; VM, ventricular muscle.
Figure 15.
Figure 15.
Hierarchical clustering. A, Two‐way hierarchical cluster analysis applied to 79 genes and to samples of right ring (n=4), retroaortic node (n=5), sinus node (n=5), atrioventricular node (n=4), atrial muscle (n=4), and ventricular muscle (n=4). B, Plot of ∆Ct values of all transcripts for ventricular muscle vs those for right ring and plot of ∆Ct values of all transcripts for retroaortic node vs those for right ring. Line represents y=x. C, Spearman rank order correlation data for same samples used for cluster analysis. AM indicates atrial muscle; AVN, atrioventricular node; RAN, retroaortic node; RR, right ring; SN, sinus node; VM, ventricular muscle.
Figure 16.
Figure 16.
Expression of Nav1.5 and SK1 proteins in AV junctional area. A, Immunolabeling of Nav1.5 (bright green signal) in right ring and AVN in AV junctional area. Long‐axis section. B, Immunolabeling of SK1 (bright red signal) in penetrating bundle. C, High magnification image of immunolabeling of SK1 in right ring. D, High magnification image of immunolabeling of SK1 in right ventricle. AVN indicates atrioventricular node; PB, penetrating bundle; RA, right atrium; RR, right ring; RV, right ventricle; VS, ventricular septum.
Figure 17.
Figure 17.
High magnification images of Cav3.1, NCX1, Kir3.1, and SK1 protein labeling. A, Cav3.1 protein labeling (green signal) in the right ring. B and C, NCX1 protein labeling (red signal) in the right ring (B) and ventricular septum (C). D and E, Kir3.1 protein labeling (green signal) in the right ring (D) and atrial muscle (E) RA. F and G, SK1 protein labeling (red signal) in atrial muscle (F) AM and the His bundle (G). AM indicates atrial muscle; HB, bundle of His; NCX1, Na+–Ca2+ exchanger; RA, right atrium; RR, right ring tissue; VS, ventricular septum.
Figure 18.
Figure 18.
Expression of Kir2.1, Kir3.4, and RYR2 proteins in right ring and right ventricle. High magnification images of immunolabeling (bright green signal) shown. RR indicates right ring; RV, right ventricle; RYR, ryanodine receptor; VS, ventricular septum.

References

    1. Anderson RH, Yanni J, Boyett MR, Chandler NJ, Dobrzynski H. The anatomy of the cardiac conduction system. Clin Anat. 2009; 22:99-113 - PubMed
    1. Anderson RH. The disposition and innervation of atrioventricular ring specialized tissue in rats and rabbits. J Anat. 1972; 113:197-211 - PMC - PubMed
    1. Yanni J, Boyett MR, Anderson RH, Dobrzynski H. The extent of the specialized atrioventricular ring tissues. Heart Rhythm. 2009; 6:672-680 - PubMed
    1. Kistler PM, Roberts‐Thomson KC, Haqqani HM, Fynn SP, Singarayar S, Vohra JK, Morton JB, Sparks PB, Kalman JM. P‐wave morphology in focal atrial tachycardia: development of an algorithm to predict the anatomic site of origin. J Am Coll Cardiol. 2006; 48:1010-1017 - PubMed
    1. Hoogaars WM, Tessari A, Moorman AF, de Boer PA, Hagoort J, Soufan AT, Campione M, Christoffels VM. The transcriptional repressor Tbx3 delineates the developing central conduction system of the heart. Cardiovasc Res. 2004; 62:489-499 - PubMed

Publication types

MeSH terms

LinkOut - more resources