. 2013 Dec 20:3:3578.
doi: 10.1038/srep03578.

Quantifying the relationship between financial news and the stock market

Affiliations

Quantifying the relationship between financial news and the stock market

Merve Alanyali et al. Sci Rep. .

Abstract

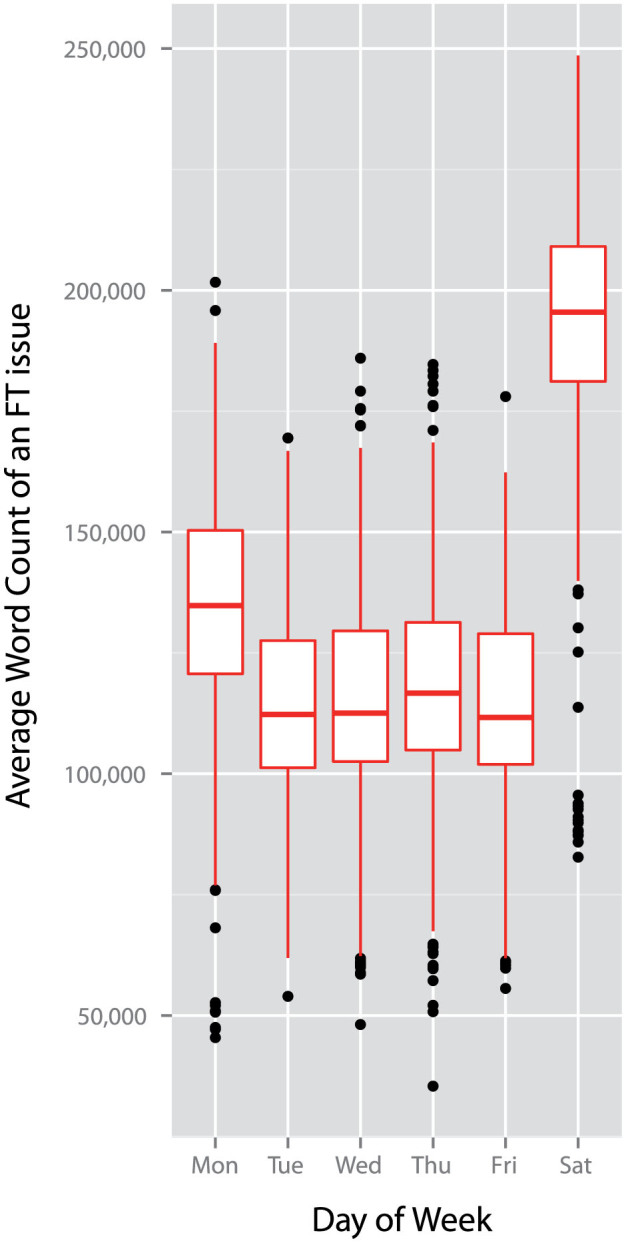
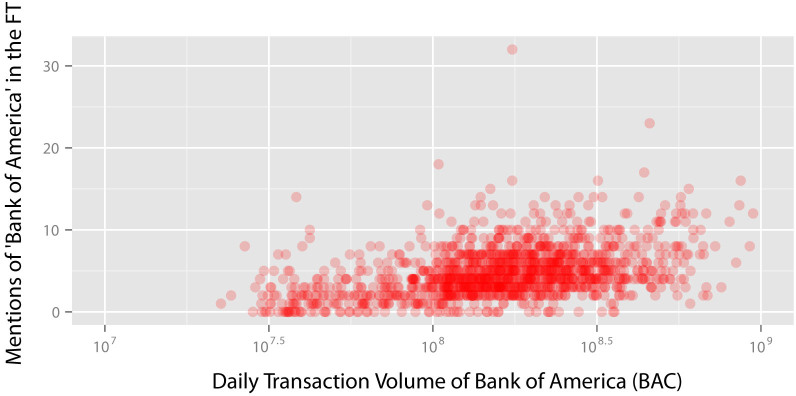
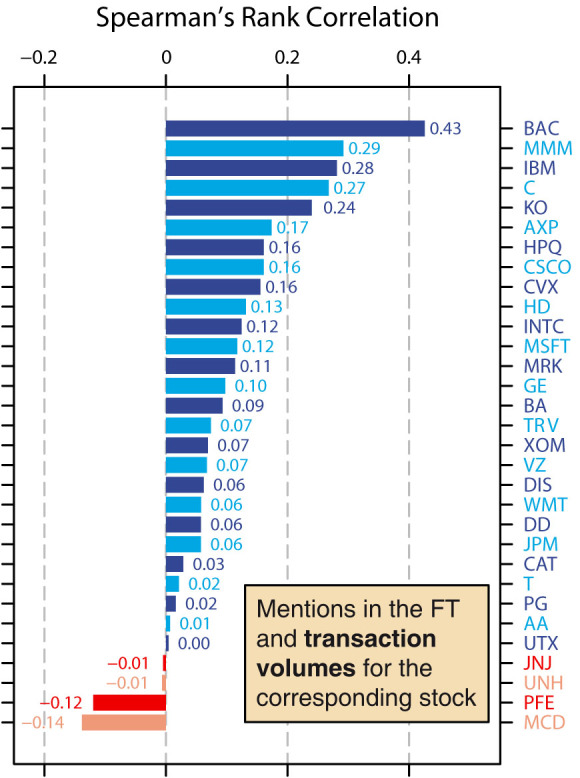
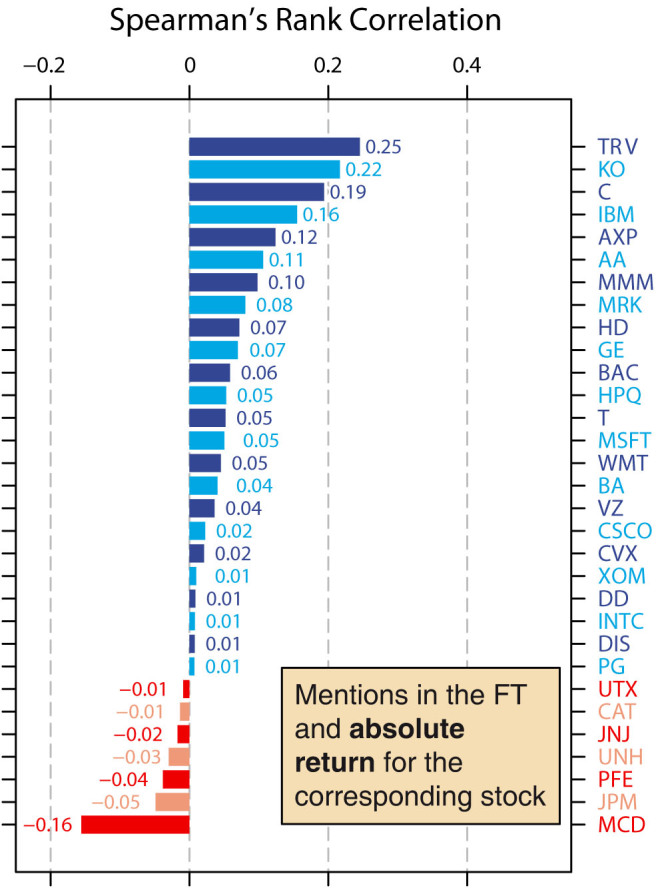
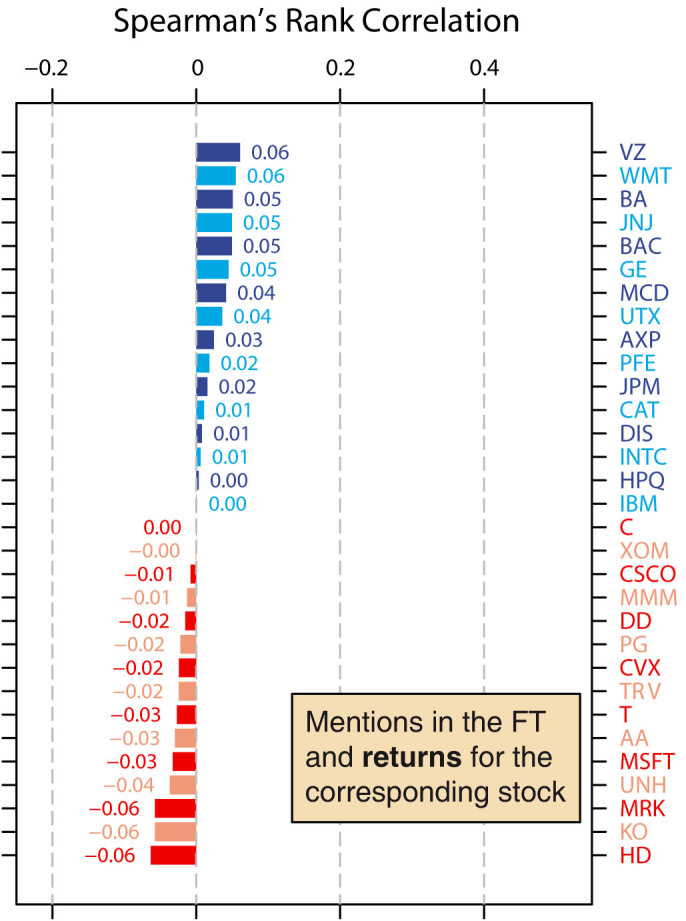
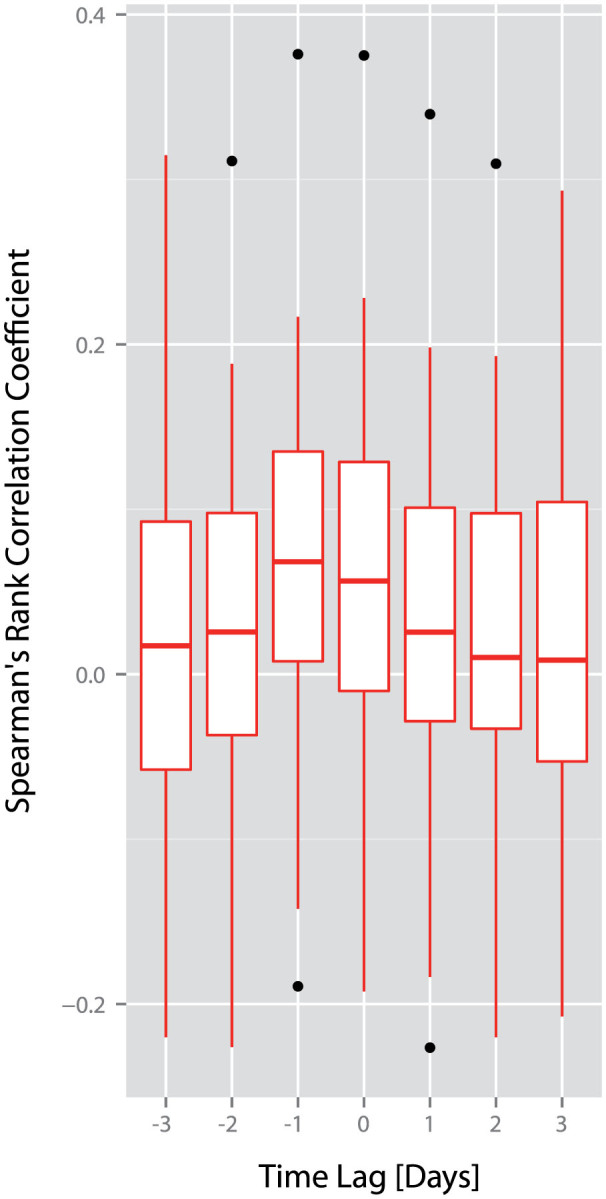
The complex behavior of financial markets emerges from decisions made by many traders. Here, we exploit a large corpus of daily print issues of the Financial Times from 2(nd) January 2007 until 31(st) December 2012 to quantify the relationship between decisions taken in financial markets and developments in financial news. We find a positive correlation between the daily number of mentions of a company in the Financial Times and the daily transaction volume of a company's stock both on the day before the news is released, and on the same day as the news is released. Our results provide quantitative support for the suggestion that movements in financial markets and movements in financial news are intrinsically interlinked.


Figures

Figure 1
Figure 1. Daily variation in the total number of words occurring in each issue of the Financial Times.
Daily variation in the total number of words in each issue of the Financial Times between 2nd January 2007 and 31st December 2012. We find significant differences in the length of the Financial Times on different days of the week (median of the number of total words for the given weekday: Monday, 134768.5; Tuesday, 112279; Wednesday, 112536; Thursday, 116690; Friday, 111663; Saturday, 195492; χ2 = 702.5324, df = 5, p < 0.001, Kruskal-Wallis rank sum test). Significantly longer issues are produced on Saturdays in comparison to the rest of the week (all Ws > 128,000, all ps < 0.001, pairwise Wilcoxon rank sum tests with Bonferroni corrected α = 0.0033), and issues on Mondays are significantly longer than issues on Tuesday to Friday (all Ws > 111,000, all ps < 0.001, pairwise Wilcoxon rank sum tests with Bonferroni corrected α = 0.0033). We find no evidence that the length of issues varies between Tuesday to Friday (all Ws < 100,000, all ps > 0.01, pairwise Wilcoxon rank sum tests with Bonferroni corrected α = 0.0033).
Figure 2
Figure 2. Daily number of mentions of “Bank of America” in the Financial Times and daily transaction volume for Bank of America (BAC) stocks.
We depict the correlation between the daily number of mentions of “Bank of America” and the daily transaction volume for Bank of America (BAC) stocks. We find that the daily number of mentions of “Bank of America” is positively correlated with the daily transaction volume for Bank of America (BAC) stocks (ρ = 0.43, p < 0.001, Spearman's rank correlation).
Figure 3
Figure 3. Correlations between daily mentions of a company's name and transaction volumes for the company's stock.
For each of the 31 companies that were listed in the Dow Jones Industrial Average between 2nd January 2008 and 31st December 2012, we plot the Spearman's rank correlation between the daily number of mentions of a company's name and the transaction volume of the corresponding company's stocks. Companies are indicated using their ticker symbol, for which a full list can be found in the Supplementary Information (Table S1). We analyze the distribution of correlation coefficients and find that, overall, the correlation coefficients are significantly higher than zero (median correlation coefficient = 0.074; mean correlation coefficient = 0.100; W = 450, p < 0.001, Wilcoxon signed rank test). In other words, the daily number of mentions of a company's name is positively correlated with the daily transaction volume of a company's stocks.
Figure 4
Figure 4. Correlations between daily mentions of a company's name and absolute return for the company's stock.
We examine whether there is a link between the daily number of mentions of a company's name and the daily absolute return of the corresponding company's stocks. We calculate Spearman's rank correlation between the daily number of mentions and the daily absolute return, and again find that overall, the correlation coefficients are significantly higher than zero (median correlation coefficient = 0.040; mean correlation coefficient = 0.047; W = 408, p = 0.0017, Wilcoxon signed rank test). In other words, the daily number of mentions of a company's name is positively correlated with the daily absolute return of the company's stocks.
Figure 5
Figure 5. Correlations between daily mentions of a company's name and return for the company's stock.
We investigate whether there is a relationship between the daily number of mentions of a company's name and the daily return of the corresponding company's stocks. Again, we calculate Spearman's rank correlation between the daily number of mentions and the daily return. Here, we find that the correlation coefficients are not significantly different to zero (median correlation coefficient = 0.000; mean correlation coefficient = 0.002; W = 262, p = 0.784, Wilcoxon signed rank test). In other words, the daily number of mentions of a company's name is not significantly correlated with the daily return of the company's stocks.
Figure 6
Figure 6. Lagged analysis of correlations between daily mentions of a company's name and transaction volumes for the company's stock.
We investigate the correlation between daily mentions of a company's name and transaction volumes for the corresponding company's stock at different time lags. We calculate correlations between the daily number of mentions of a company's name and the daily transaction volume for a company from three days beforehand (indicated as −3 on the x-axis) to three days afterwards (indicated as 3 on the x-axis). We find that correlation coefficients for daily transaction volume one day before the news (−1) and on the same day as the news (0) are significantly greater than zero (lag −1: W = 373, p = 0.014; lag 0: W = 362, p = 0.026, Wilcoxon signed rank tests). In other words, a greater number of mentions of a company in the Financial Times is related to a greater transaction volume for a company's stocks on the same day and on the previous day. We find no significant relationship between the daily number of mentions of a company's name in the Financial Times and transaction volume at any other lag (lag −3: W = 270, p = 0.666; lag −2: W = 301, p = 0.299; lag 1: W = 317, p = 0.176; lag 2: W = 307, p = 0.248; lag 3: W = 298, p = 0.327; Wilcoxon signed rank tests).

References

    1. Fehr E. Behavioral science: The economics of impatience. Nature 415, 269–272 (2002). - PubMed
    1. Gabaix X., Gopikrishnan P., Plerou V. & Stanley H. E. A theory of power-law distributions in financial market fluctuations. Nature 423, 267–270 (2003). - PubMed
    1. Preis T., Schneider J. J. & Stanley H. E. Switching processes in financial markets. Proc. Natl. Acad. Sci. U.S.A. 108, 7674–7678 (2011). - PMC - PubMed
    1. Podobnik B., Horvatic D., Petersen A. M. & Stanley H. E. Cross-correlations between volume change and price change. Proc. Natl. Acad. Sci. U.S.A. 106, 22079–22084 (2009). - PMC - PubMed
    1. Feng L., Li B., Podobnik B., Preis T. & Stanley H. E. Linking agent-based models and stochastic models of financial markets. Proc. Natl. Acad. Sci. U.S.A. 109, 8388–8393 (2012). - PMC - PubMed

Publication types

LinkOut - more resources