. 2014 Jan;9(1):146-55.
doi: 10.1038/nprot.2014.001. Epub 2013 Dec 19.

Using Spinach-based sensors for fluorescence imaging of intracellular metabolites and proteins in living bacteria

Affiliations

Using Spinach-based sensors for fluorescence imaging of intracellular metabolites and proteins in living bacteria

Rita L Strack et al. Nat Protoc. 2014 Jan.

Abstract

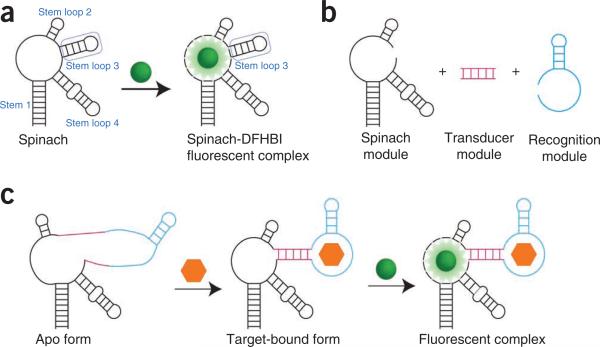
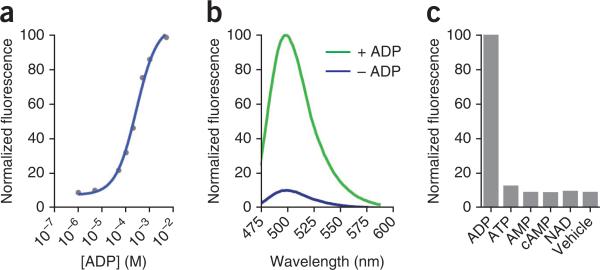
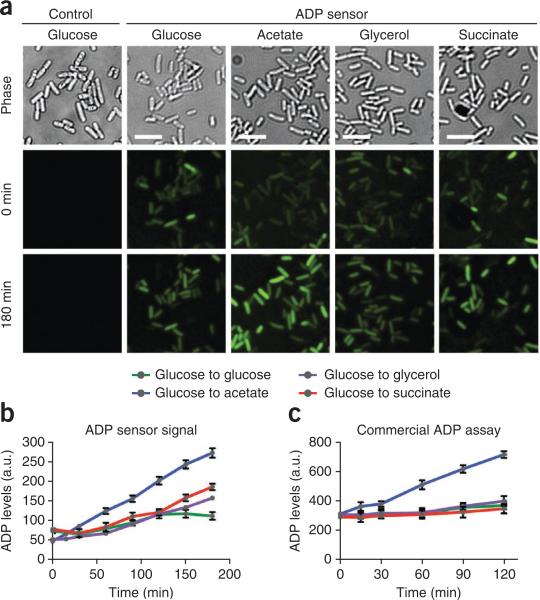
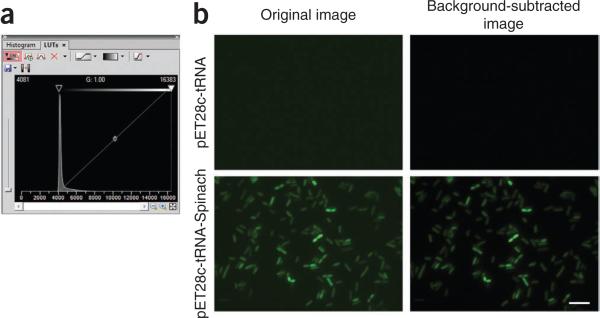
Genetically encoded fluorescent sensors can be valuable tools for studying the abundance and flux of molecules in living cells. We recently developed a novel class of sensors composed of RNAs that can be used to detect diverse small molecules and untagged proteins. These sensors are based on Spinach, an RNA mimic of GFP, and they have successfully been used to image several metabolites and proteins in living bacteria. Here we discuss the generation and optimization of these Spinach-based sensors, which, unlike most currently available genetically encoded reporters, can be readily generated to any target of interest. We also provide a detailed protocol for imaging ADP dynamics in living Escherichia coli after a change from glucose-containing medium to other carbon sources. The entire procedure typically takes ∼4 d including bacteria transformation and image analysis. The majority of this protocol is applicable to sensing other metabolites and proteins in living bacteria.


Figures

Figure 1
Figure 1
Modular strategy for generating Spinach-based sensors. (a) Spinach is an RNA aptamer that binds a small-molecule dye called DFHBI (green ball). Both DFHBI and Spinach are nonfluorescent until binding occurs and activates the fluorescence of the Spinach-DFHBI complex. Stem loop 3 of Spinach can tolerate insertion of additional sequences, and it is the region that is modified to generate sensors. (b) In Spinach-based sensors, Spinach is modified to include a transducer region (magenta) and a recognition module (cyan). Recognition molecules are typically aptamers generated against a target ligand by SELEX,, but they can also be composed of riboswitch regions, and naturally occurring RNAs. Transducers of varied length and composition can be generated in order to optimize sensor function. (c) In the absence of DFHBI and ligand (orange hexagon), the Spinach-based sensor displays minimal fluorescence. However, upon target binding, the recognition module of the sensor folds and induces folding of the Spinach portion of the sensor. The Spinach-based sensor is then able to bind DFHBI and activate fluorescence.
Figure 2
Figure 2
Characteristics of the ADP sensor. (a) Dose-response curve of fluorescence of the ADP sensor with increasing concentrations of ADP. (b) Emission spectra of the ADP sensor in the presence or absence of ADP. (c) Molecular discrimination of the ADP sensor. Fluorescence brightness values for the ADP sensor in the presence of 1 mM ADP, ATP, AMP, cyclic AMP (cAMP), nicotinamide adenine dinucleotide (NAD) or vehicle are shown.
Figure 3
Figure 3
Live-cell imaging and analysis of endogenous ADP levels. (a) E. coli cells expressing the ADP sensor grown in various carbon sources. Cells grown in minimal medium containing 200 μM DFHBI and glucose were switched to alternate carbon sources as indicated. Images shown were obtained at 0 and 180 min after medium change, respectively. Scale bars, 5 μm. (b) Quantification of ADP levels on the basis of ADP sensor fluorescence signal. Individual cells were imaged over 3 h, and fluorescence was measured and normalized to cellular area by using ImageJ software. Results shown represent mean and s.e.m. values for 150 cells per condition. (c) Quantification of ADP levels by using a commercially available ADP assay. Cells grown under identical conditions to those used for the ADP sensor assay were subjected to a bulk fluorometric ADP assay. Shown are mean and s.e.m. values for three independent experiments. The results of this assay correlate well to signal changes observed using the ADP sensor. a.u., arbitrary units.
Figure 4
Figure 4
Background subtraction using the NIS Elements software. (a) Screenshot of the LUT panel of the NIS Elements software. Background subtraction should be carried out by adjusting the lower threshold (yellow arrow) such that the mean intensity within an E. coli is zero. The mean intensity within a cell is typically zero when the lower threshold is set adjacent to the intensity peak as shown. (b) Examples of background-subtracted images. Images are shown before (left column) and after (right column) background subtraction. The upper row shows negative control cells, expressing tRNALys alone. The lower row shows cells expressing Spinach. Scale bar, 5 μ.
Figure 5
Figure 5
Quantification of mean fluorescence in E. coli. Screenshot of image analysis with Fiji software. The free drawing tool (green arrow in toolbar) can be selected in order to draw a circle around an E. coli cell of interest (yellow circle, yellow arrow). Once this object is selected, the software will calculate the average intensity within the cell. This value will be displayed in a pop-up window, as indicated by the red arrow.

Similar articles

Cited by

References

    1. Paige JS, Wu KY, Jaffrey SR. RNA mimics of green fluorescent protein. Science. 2011;333:642–646. - PMC - PubMed
    1. Paige JS, Nguyen-Duc T, Song W, Jaffrey SR. Fluorescence imaging of cellular metabolites with RNA. Science. 2012;335:1194. - PMC - PubMed
    1. Song W, Strack RL, Jaffrey SR. Imaging bacterial protein expression using genetically encoded RNA sensors. Nat. Methods. 2013;10:873–875. - PMC - PubMed
    1. Strack RL, Jaffrey SR. New approaches for sensing metabolites and proteins in live cells using RNA. Curr. Opin. Chem. Biol. 2013;17:651–655. - PMC - PubMed
    1. Ellington AD, Szostak JW. In vitro selection of RNA molecules that bind specific ligands. Nature. 1990;346:818–822. - PubMed

Publication types

MeSH terms