

Dysregulated D-dopachrome tautomerase, a hypoxia-inducible factor-dependent gene, cooperates with macrophage migration inhibitory factor in renal tumorigenesis
- PMID: 24356968
- PMCID: PMC3916569
- DOI: 10.1074/jbc.M113.500694
Dysregulated D-dopachrome tautomerase, a hypoxia-inducible factor-dependent gene, cooperates with macrophage migration inhibitory factor in renal tumorigenesis
Abstract
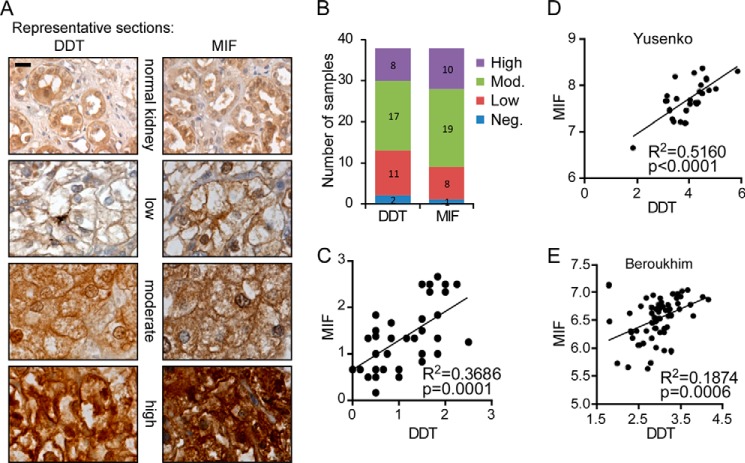
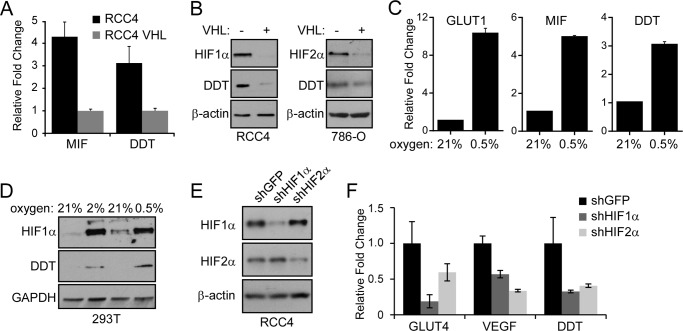
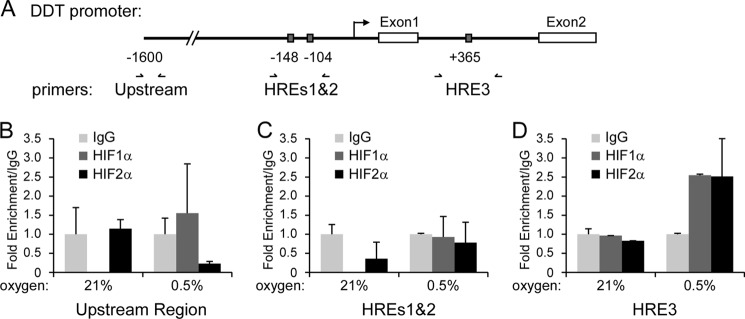
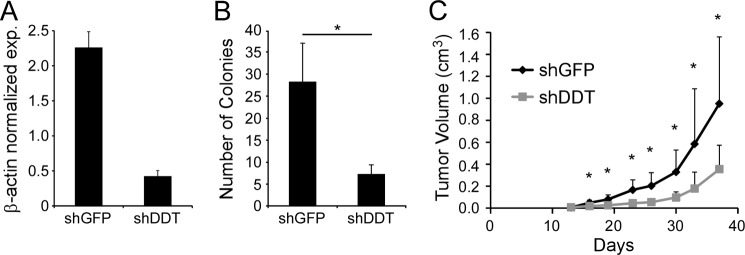
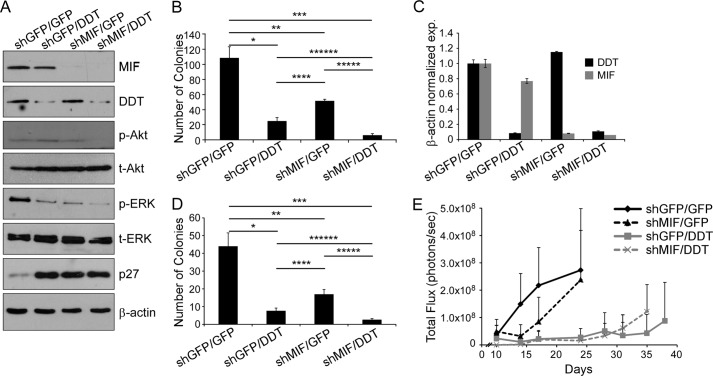
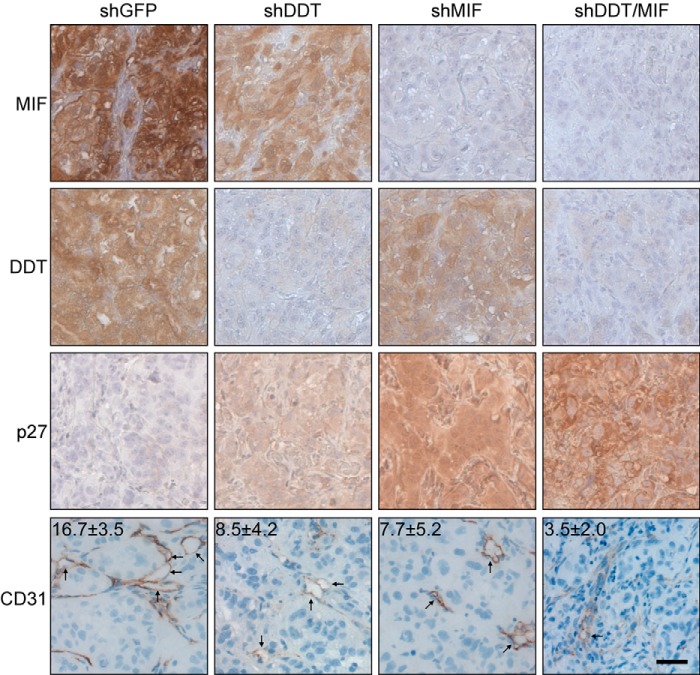
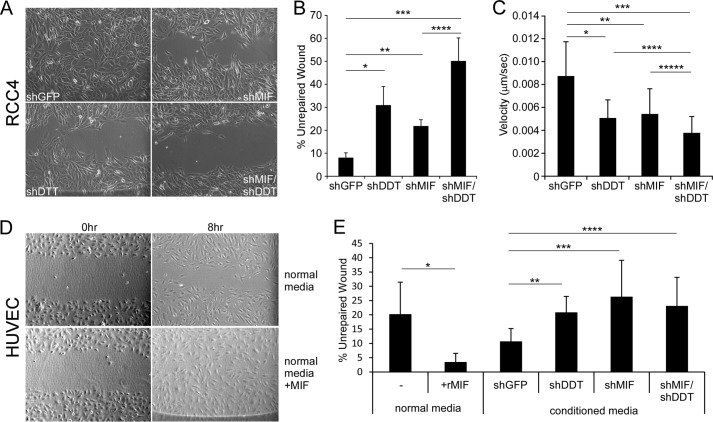
Clear cell renal cell carcinomas (ccRCCs) are characterized by biallelic loss of the von Hippel-Lindau tumor suppressor and subsequent constitutive activation of the hypoxia-inducible factors, whose transcriptional programs dictate major phenotypic attributes of kidney tumors. We recently described a role for the macrophage migration inhibitory factor (MIF) in ccRCC as an autocrine-signaling molecule with elevated expression in tumor tissues and in the circulation of patients that has potent tumor cell survival effects. MIF is a pleiotropic cytokine implicated in a variety of diseases and cancers and is the target of both small molecule and antibody-based therapies currently in clinical trials. Recent work by others has described D-dopachrome tautomerase (DDT) as a functional homologue of MIF with a similar genomic structure and expression patterns. Thus, we sought to determine a role for DDT in renal cancer. We find that DDT expression mirrors MIF expression in ccRCC tumor sections with high correlation and that, mechanistically, DDT is a novel hypoxia-inducible gene and direct target of HIF1α and HIF2α. Functionally, DDT and MIF demonstrate a significant overlap in controlling cell survival, tumor formation, and tumor and endothelial cell migration. However, DDT inhibition consistently displayed more severe effects on most phenotypes. Accordingly, although dual inhibition of DDT and MIF demonstrated additive effects in vitro, DDT plays a dominant role in tumor growth in vivo. Together, our findings identify DDT as a functionally redundant but more potent cytokine to MIF in cancer and suggest that current attempts to inhibit MIF signaling may fail because of DDT compensation.
Keywords: Cancer Biology; Clear Cell Renal Cell Carcinoma; DDT; Gene Regulation; Hypoxia; Hypoxia-inducible Factor (HIF); Kidney; MIF; VHL; von Hippel-Lindau.
Figures
Similar articles
-
Hypoxia, Hypoxia-inducible Transcription Factors, and Renal Cancer.Eur Urol. 2016 Apr;69(4):646-657. doi: 10.1016/j.eururo.2015.08.007. Epub 2015 Aug 19. Eur Urol. 2016. PMID: 26298207 Free PMC article. Review.
-
The von Hippel-Lindau tumor suppressor protein regulates gene expression and tumor growth through histone demethylase JARID1C.Oncogene. 2012 Feb 9;31(6):776-86. doi: 10.1038/onc.2011.266. Epub 2011 Jul 4. Oncogene. 2012. PMID: 21725364 Free PMC article.
-
Hypoxia-inducible factor augments experimental colitis through an MIF-dependent inflammatory signaling cascade.Gastroenterology. 2008 Jun;134(7):2036-48, 2048.e1-3. doi: 10.1053/j.gastro.2008.03.009. Epub 2008 Mar 10. Gastroenterology. 2008. PMID: 18439915 Free PMC article.
-
Unraveling the role of hypoxia-inducible factor (HIF)-1α and HIF-2α in the adaption process of human microvascular endothelial cells (HMEC-1) to hypoxia: Redundant HIF-dependent regulation of macrophage migration inhibitory factor.Microvasc Res. 2018 Mar;116:34-44. doi: 10.1016/j.mvr.2017.09.004. Epub 2017 Oct 6. Microvasc Res. 2018. PMID: 28993199
-
The Role of Macrophage Migration Inhibitory Factor and Its Homolog D-Dopachrome Tautomerase in Ultraviolet Radiation-Induced Carcinogenesis: New Insights Into Skin Cancer Mechanisms.Photodermatol Photoimmunol Photomed. 2025 Sep;41(5):e70046. doi: 10.1111/phpp.70046. Photodermatol Photoimmunol Photomed. 2025. PMID: 40847634 Review.
Cited by
-
D-dopachrome tautomerase activates COX2/PGE2 pathway of astrocytes to mediate inflammation following spinal cord injury.J Neuroinflammation. 2021 Jun 11;18(1):130. doi: 10.1186/s12974-021-02186-z. J Neuroinflammation. 2021. PMID: 34116703 Free PMC article.
-
MIF family members cooperatively inhibit p53 expression and activity.PLoS One. 2014 Jun 16;9(6):e99795. doi: 10.1371/journal.pone.0099795. eCollection 2014. PLoS One. 2014. PMID: 24932684 Free PMC article.
-
An atypical atherogenic chemokine that promotes advanced atherosclerosis and hepatic lipogenesis.Nat Commun. 2025 Mar 7;16(1):2297. doi: 10.1038/s41467-025-57540-z. Nat Commun. 2025. PMID: 40055309 Free PMC article.
-
MIF contribution to progressive brain diseases.J Neuroinflammation. 2024 Jan 4;21(1):8. doi: 10.1186/s12974-023-02993-6. J Neuroinflammation. 2024. PMID: 38178143 Free PMC article. Review.
-
DNA Methylation Profiles of Vegans and Non-Vegetarians in the Adventist Health Study-2 Cohort.Nutrients. 2020 Nov 30;12(12):3697. doi: 10.3390/nu12123697. Nutrients. 2020. PMID: 33266012 Free PMC article.
References
-
- Siegel R., Naishadham D., Jemal A. (2013) Cancer statistics, 2013. CA-Cancer J. Clin. 63, 11–30 - PubMed
-
- Drabkin H. A., Gemmill R. M. (2012) Cholesterol and the development of clear-cell renal carcinoma. Curr. Opin. Pharmacol. 12, 742–750 - PubMed
-
- Ericsson J. L., Seljelid R., Orrenius S. (1966) Comparative light and electron microscopic observations of the cytoplasmic matrix in renal carcinomas. Virchows Arch. Pathol. Anat. Physiol. Klin. Med. 341, 204–223 - PubMed
-
- (2012) ACS Cancer Facts and Figures. Cancer Facts and Figures. American Cancer Society. Cancer Society, Atlanta, GA
-
- Rini B. I., Campbell S. C., Escudier B. (2009) Renal cell carcinoma. Lancet 373, 1119–1132 - PubMed
Publication types
MeSH terms
Substances
Grants and funding
LinkOut - more resources
Full Text Sources
Other Literature Sources
Medical
Miscellaneous
