

Structure-guided development of specific pyruvate dehydrogenase kinase inhibitors targeting the ATP-binding pocket
- PMID: 24356970
- PMCID: PMC3924305
- DOI: 10.1074/jbc.M113.533885
Structure-guided development of specific pyruvate dehydrogenase kinase inhibitors targeting the ATP-binding pocket
Abstract
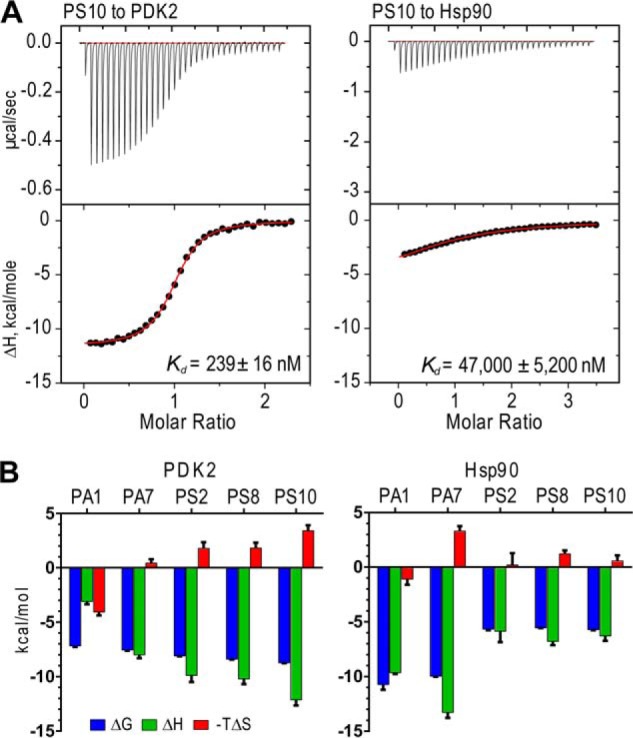
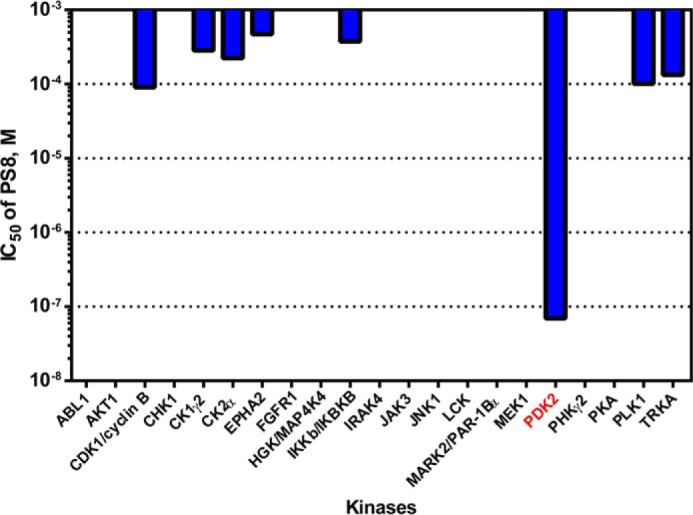
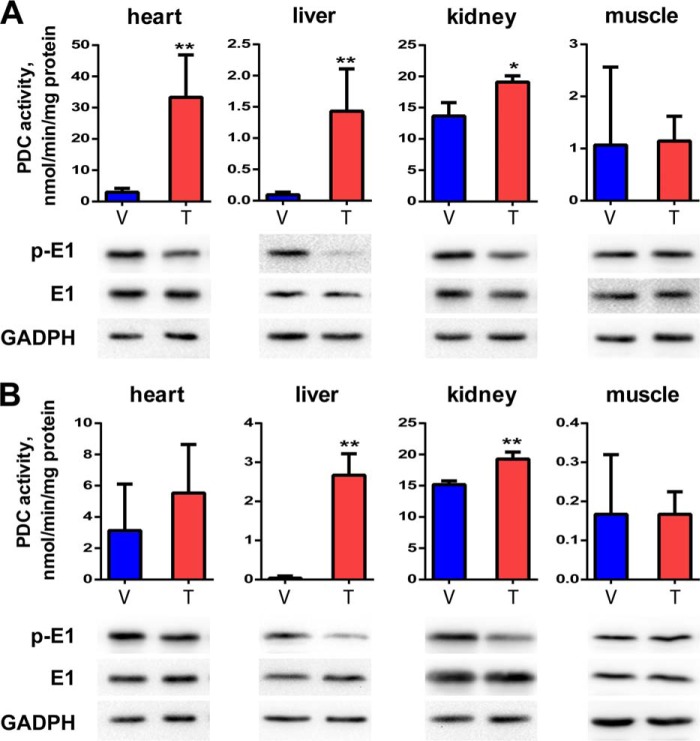
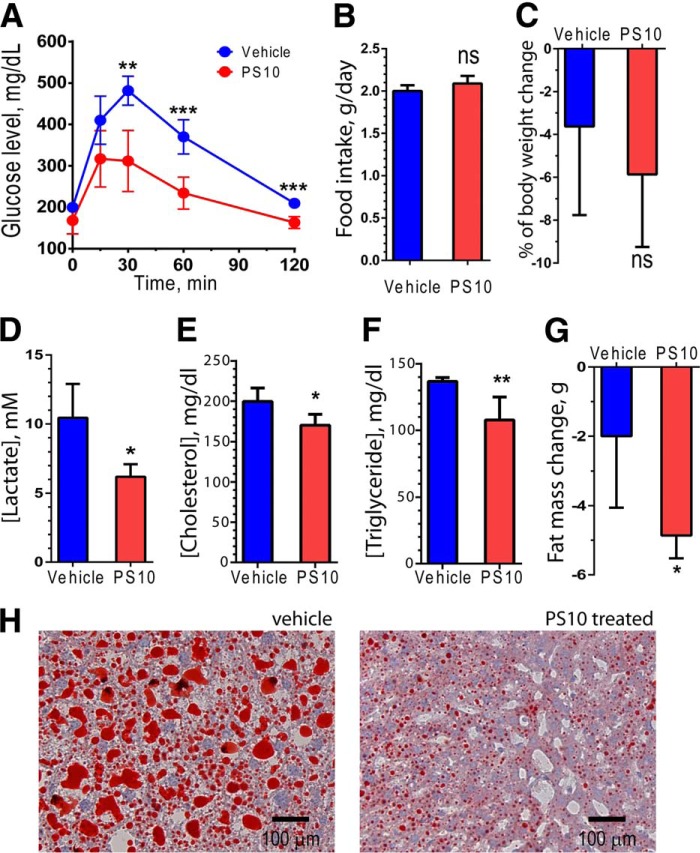
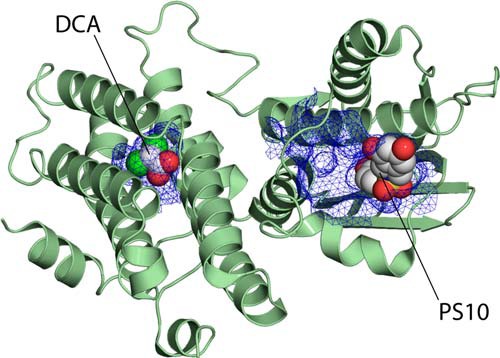
Pyruvate dehydrogenase kinase isoforms (PDKs 1-4) negatively regulate activity of the mitochondrial pyruvate dehydrogenase complex by reversible phosphorylation. PDK isoforms are up-regulated in obesity, diabetes, heart failure, and cancer and are potential therapeutic targets for these important human diseases. Here, we employed a structure-guided design to convert a known Hsp90 inhibitor to a series of highly specific PDK inhibitors, based on structural conservation in the ATP-binding pocket. The key step involved the substitution of a carbonyl group in the parent compound with a sulfonyl in the PDK inhibitors. The final compound of this series, 2-[(2,4-dihydroxyphenyl)sulfonyl]isoindoline-4,6-diol, designated PS10, inhibits all four PDK isoforms with IC50 = 0.8 μM for PDK2. The administration of PS10 (70 mg/kg) to diet-induced obese mice significantly augments pyruvate dehydrogenase complex activity with reduced phosphorylation in different tissues. Prolonged PS10 treatments result in improved glucose tolerance and notably lessened hepatic steatosis in the mouse model. The results support the pharmacological approach of targeting PDK to control both glucose and fat levels in obesity and type 2 diabetes.
Keywords: Diabetes; Drug Development; Enzyme Inhibitors; Glucose Metabolism; Hepatic Steatosis; Mitochondrial Protein Kinase; Pyruvate Dehydrogenase Complex; Pyruvate Dehydrogenase Kinase; Structure-based Inhibitor Design.
Figures
Similar articles
-
Targeting hepatic pyruvate dehydrogenase kinases restores insulin signaling and mitigates ChREBP-mediated lipogenesis in diet-induced obese mice.Mol Metab. 2018 Jun;12:12-24. doi: 10.1016/j.molmet.2018.03.014. Epub 2018 Mar 31. Mol Metab. 2018. PMID: 29656110 Free PMC article.
-
A novel inhibitor of pyruvate dehydrogenase kinase stimulates myocardial carbohydrate oxidation in diet-induced obesity.J Biol Chem. 2018 Jun 22;293(25):9604-9613. doi: 10.1074/jbc.RA118.002838. Epub 2018 May 8. J Biol Chem. 2018. PMID: 29739849 Free PMC article.
-
Development of Dihydroxyphenyl Sulfonylisoindoline Derivatives as Liver-Targeting Pyruvate Dehydrogenase Kinase Inhibitors.J Med Chem. 2017 Feb 9;60(3):1142-1150. doi: 10.1021/acs.jmedchem.6b01540. Epub 2017 Jan 31. J Med Chem. 2017. PMID: 28085286 Free PMC article.
-
Therapeutic Targeting of the Pyruvate Dehydrogenase Complex/Pyruvate Dehydrogenase Kinase (PDC/PDK) Axis in Cancer.J Natl Cancer Inst. 2017 Nov 1;109(11). doi: 10.1093/jnci/djx071. J Natl Cancer Inst. 2017. PMID: 29059435 Review.
-
Targeting pyruvate dehydrogenase kinase signaling in the development of effective cancer therapy.Biochim Biophys Acta Rev Cancer. 2021 Aug;1876(1):188568. doi: 10.1016/j.bbcan.2021.188568. Epub 2021 May 21. Biochim Biophys Acta Rev Cancer. 2021. PMID: 34023419 Review.
Cited by
-
Benzene construction via Pd-catalyzed cyclization of 2,7-alkadiynylic carbonates in the presence of alkynes.Chem Sci. 2018 Dec 19;10(7):2228-2235. doi: 10.1039/c8sc04681f. eCollection 2019 Feb 21. Chem Sci. 2018. PMID: 30881648 Free PMC article.
-
Multi-omics derivation of a core gene signature for predicting therapeutic response and characterizing immune dysregulation in inflammatory bowel disease.Front Immunol. 2025 Jul 31;16:1611598. doi: 10.3389/fimmu.2025.1611598. eCollection 2025. Front Immunol. 2025. PMID: 40821793 Free PMC article.
-
Molecular docking studies of (4Z, 12Z)-cyclopentadeca-4, 12-dienone from Grewia hirsuta with some targets related to type 2 diabetes.BMC Complement Altern Med. 2015 Mar 20;15:73. doi: 10.1186/s12906-015-0588-5. BMC Complement Altern Med. 2015. PMID: 25885803 Free PMC article.
-
Ilimaquinone Induces the Apoptotic Cell Death of Cancer Cells by Reducing Pyruvate Dehydrogenase Kinase 1 Activity.Int J Mol Sci. 2020 Aug 21;21(17):6021. doi: 10.3390/ijms21176021. Int J Mol Sci. 2020. PMID: 32825675 Free PMC article.
-
PDK4 Deficiency Suppresses Hepatic Glucagon Signaling by Decreasing cAMP Levels.Diabetes. 2018 Oct;67(10):2054-2068. doi: 10.2337/db17-1529. Epub 2018 Jul 31. Diabetes. 2018. PMID: 30065033 Free PMC article.
References
-
- Reed L. J. (2001) A trail of research from lipoic acid to α-keto acid dehydrogenase complexes. J. Biol. Chem. 276, 38329–38336 - PubMed
-
- Randle P. J. (1995) Metabolic fuel selection: general integration at the whole-body level. Proc. Nutr. Soc. 54, 317–327 - PubMed
-
- Harris R. A., Hawes J. W., Popov K. M., Zhao Y., Shimomura Y., Sato J., Jaskiewicz J., Hurley T. D. (1997) Studies on the regulation of the mitochondrial α-ketoacid dehydrogenase complexes and their kinases. Adv. Enzyme Regul. 37, 271–293 - PubMed
-
- Wu P., Inskeep K., Bowker-Kinley M. M., Popov K. M., Harris R. A. (1999) Mechanism responsible for inactivation of skeletal muscle pyruvate dehydrogenase complex in starvation and diabetes. Diabetes 48, 1593–1599 - PubMed
-
- Rosa G., Di Rocco P., Manco M., Greco A. V., Castagneto M., Vidal H., Mingrone G. (2003) Reduced PDK4 expression associates with increased insulin sensitivity in postobese patients. Obes. Res. 11, 176–182 - PubMed
Publication types
MeSH terms
Substances
Associated data
- Actions
- Actions
- Actions
- Actions
- Actions
Grants and funding
LinkOut - more resources
Full Text Sources
Other Literature Sources
Chemical Information
Medical
Molecular Biology Databases
