. 2014 Mar;34(3):626-34.
doi: 10.1161/ATVBAHA.113.302576. Epub 2013 Dec 19.

Cystathionine γ-lyase accelerates osteoclast differentiation: identification of a novel regulator of osteoclastogenesis by proteomic analysis

Affiliations

Cystathionine γ-lyase accelerates osteoclast differentiation: identification of a novel regulator of osteoclastogenesis by proteomic analysis

Takahiro Itou et al. Arterioscler Thromb Vasc Biol. 2014 Mar.

Abstract

Objective: Clinical evidence has linked vascular calcification in advanced atherosclerotic plaques with overt cardiovascular disease and mortality. Bone resorbing monocyte-derived osteoclast-like cells are sparse in these plaques, indicating that their differentiation capability could be suppressed. Here, we seek to characterize the process of osteoclastogenesis by identifying novel regulators and pathways, with the aim of exploring possible strategies to reduce calcification.

Approach and results: We used a quantitative mass spectrometry strategy, tandem mass tagging, to quantify changes in the proteome of osteoclast-like cells differentiated from RAW264.7 cells in response to, receptor activator of nuclear factor κ-B ligand induction, a common in vitro model for osteogenesis. More than 4000 proteins were quantified, of which 138 were identified as novel osteoclast-related proteins. We selected 5 proteins for subsequent analysis (cystathionine γ-lyase [Cth/CSE], EGF-like repeat and discoidin I-like domain-containing protein 3, integrin α FG-GAP repeat containing 3, adseverin, and serpinb6b) and show that gene expression levels are also increased. Further analysis of the CSE transcript profile reveals an early onset of an mRNA increase. Silencing of CSE by siRNA and dl-propargylglycine, a CSE inhibitor, attenuated receptor activator of nuclear factor κ-B ligand-induced tartrate-resistant acid phosphatase type 5 activity and pit formation, suggesting that CSE is a potent inducer of calcium resorption. Moreover, knockdown of CSE suppressed expression of osteoclast differentiation markers.

Conclusions: Our large-scale proteomics study identified novel candidate regulators or markers for osteoclastogenesis and demonstrated that CSE may act in early stages of osteoclastogenesis.

Keywords: RANKL protein; macrophages; osteoclast; proteomics; vascular calcification.


Figures

Figure 1
Figure 1
Tandem mass tagging (TMT)-based protein profiling of RANKL-induced osteoclastogenesis of RAW264.7 cells. A, RAW264.7 cells were cultured with or without 100 ng/mL of RANKL for three days to induce osteoclast differentiation. B, Corresponding TRAP activity from (A). C, TMT labeling strategy: Each biological replicate (3 control, 3 +RANKL) was harvested at Day 3 of culture for subsequent cell lysis, proteolysis (trypsinization) and peptide labeling with one of six TMT chemicals (126 through 131, each uniquely colored). Labeled peptides (colored lines at step 3) were combined, fractionated by OFF-gel and analyzed by LC/MS/MS. D, Example tandem mass spectra. The intact peptide scan (MS1) is the combined signal of all six TMT-tagged peptides. The fragmentation scan (MS2) provides fragment ions for both peptide identification and TMT reporter ion intensities (red box) for relative peptide abundance profiling. E, Inset from D highlighting the possible outcomes for the relative TMT reporter intensities: no change, or an increase or decrease (red arrows are indicated respectively). The changes in abundance are reinforced by the three biological replicates. Scale bar 500μm. data shown in mean ± SD (n=4). * p <0.05.
Figure 2
Figure 2. Overview of proteomics data
A, Venn diagrams of the total number of quantified peptides and proteins (2 or more unique peptides) from two independent TMT experiments (TMT1 and TMT2). B, The normalized log ratio plot of [Osteoclast/Macrophage] protein abundances from TMT experiment 2. Proteins known to increase or decrease during osteoclastogenesis are indicated. The number of quantified peptides is indicated in parentheses. n = 4,244 and significant outliers (α < 0.05) are highlighted in the red boxes. C, A correlation plot of the TMT1 and TMT2 normalized log ratios [Osteoclast/Macrophage]. D–G, Example MS2 peptide spectra; a known osteoclast marker, Acp5 (TRAP) (D); Psb3, a control protein whose abundance did not change as a function of osteoclastogenesis (E); and two novel osteoclast-associated proteins identified in this study, Edil3 (F) and Cth /CSE (G); The red box indicates the TMT reporter m/z range. The inset to the right of each spectrum is the expansion of the TMT reporters. Lower case letters in the peptide sequences indicate the sites of TMT labeling. The peak corresponding to the TMT tag minus the NHS-ester (m/z 230.17) was sometimes observed (black dot). Inset: Grey dots indicate reporters from the macrophage controls and red dots indicate the reporters from osteoclasts.
Figure 3
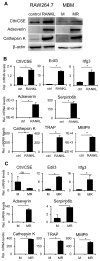
Figure 3. Protein and mRNA expression profiles of candidate osteoclast markers
A, Western blot analysis of Cth/CSE, Adseverin, Cathepsin K and β-actin from control and RANKL-induced RAW264.7 and mouse bone marrow cells (MBM). B, Real-time PCR analysis of control vs RANKL-induced RAW264.7 cells. C, Real-time PCR analysis of MBM cells treated with M-CSF+RANKL (MR) vs. controls treated with M-CSF only (M). mRNA levels were normalized to GAPDH, a house-keeping gene. Data are shown in mean ± SD (n=3), * p <0.05.
Figure 4
Figure 4. CSE promotes RANKL-induced osteoclastogenesis
A, Immunolocalization of CSE (red), F-actin (green) and nuclei (DAPI, blue) in control RAW264.7 cells versus RANKL-induced osteoclasts, bar = 100 μm. B, Pit formation assays for control and RANKL-induced, non-Targeting siRNA (WT/NT) RAW264.7 cells and siRNA (RANK or CSE) transfected cells. C, Pit formation assays for control and RANKL-induced RAW264.7 cells with or without 5 mM of DL-propargylglycine (PAG). D, Quantification of pit resorption from (B). E, Relative TRAP activity from (B). F, Quantification of pit resorption from (C). G, Relative TRAP activity from (C). Bars=500 μm. Data are shown in mean ± SD (n=4). H, mRNA expression of osteoclast markers from non-targeting (NT), RANK or CSE siRNA-transfected RAW264.7 cells cultured with our without RANKL for three days. R: RANKL. I, mRNA expression from RAW264.7 cells cultured with or without 100 ng/mL RANKL and 5 mM PAG, respectively, for three days. Data are shown in mean ± SD (n=3). * p <0.05.
Figure 5
Figure 5. Effect of H2S donor, GYY4137, on osteoclastogenesis
A, TRAP and pit resorption assays of RANKL-differentiated RAW264.7 cells treated with increasing concentrations of GYY4137 for four days. B, Quantification for TRAP straining of multinucleated cells (MNCs) in (A). C, Quantification for resorption assay in (A). D, Recovery of osteoclastogenesis by addition of 200 μM of GYY4137 after CSE inhibition with PAG. Data shown in mean ± SD (n=3). * p<0.05. Bars=500μm.
Figure 6
Figure 6
Increased expression of CSE protein in advanced atherosclerotic lesions. A and F show sections stained with HE, bounding box identifies augmented area. K shows merged image identifying different regions (lumen, plaque and media). Bars= 100μm. Representative photomicrographs of adjacent section demonstrating CSE (B, G and L, red) CD68 (C and H, green) and OSCAR (M, green) immunoreactivity in 20-week-old wild type (A to E) and apoE−/− mice fed with high fat diet (F to O). D, I, and N: Nuclei (DAPI, blue). E, J and O: Merged. CSE immunoreactivity was seen in both intima and medial smooth muscle cells and co-expressed with macrophages CD68 (J) and OSCAR-positive osteoclast-like cells in the plaque (O). Bars= 50 μm.

Comment in

References

    1. Demer LL, Tintut Y. Vascular calcification: pathobiology of a multifaceted disease. Circulation. 2008;117:2938–2948. - PMC - PubMed
    1. Towler DA. Vascular calcification: a perspective on an imminent disease epidemic. IBMS BoneKEy. 2008;5:41–58.
    1. Aikawa E, Aikawa M, Libby P, Figueiredo JL, Rusanescu G, Iwamoto Y, Fukuda D, Kohler RH, Shi GP, Jaffer FA, Weissleder R. Arterial and aortic valve calcification abolished by elastolytic cathepsin S deficiency in chronic renal disease. Circulation. 2009;119:1785–94. - PMC - PubMed
    1. Huang H, Virmani R, Younis H, Burke AP, Kamm RD, Lee RT. The impact of calcification on the biomechanical stability of atherosclerotic plaques. Circulation. 2001;103:1051–1056. - PubMed
    1. Kelly-Arnold A, Maldonado N, Laudier D, Aikawa E, Cardoso L, Weinbaum S. Revised microcalcification hypothesis for fibrous cap rupture in human coronary arteries. Proc Natl Acad Sci U S A. 2013;110:10741–10746. - PMC - PubMed

Publication types

MeSH terms

LinkOut - more resources