

Spino-olivary projections in the rat are anatomically separate from postsynaptic dorsal column projections
- PMID: 24357064
- PMCID: PMC4282304
- DOI: 10.1002/cne.23527
Spino-olivary projections in the rat are anatomically separate from postsynaptic dorsal column projections
Abstract
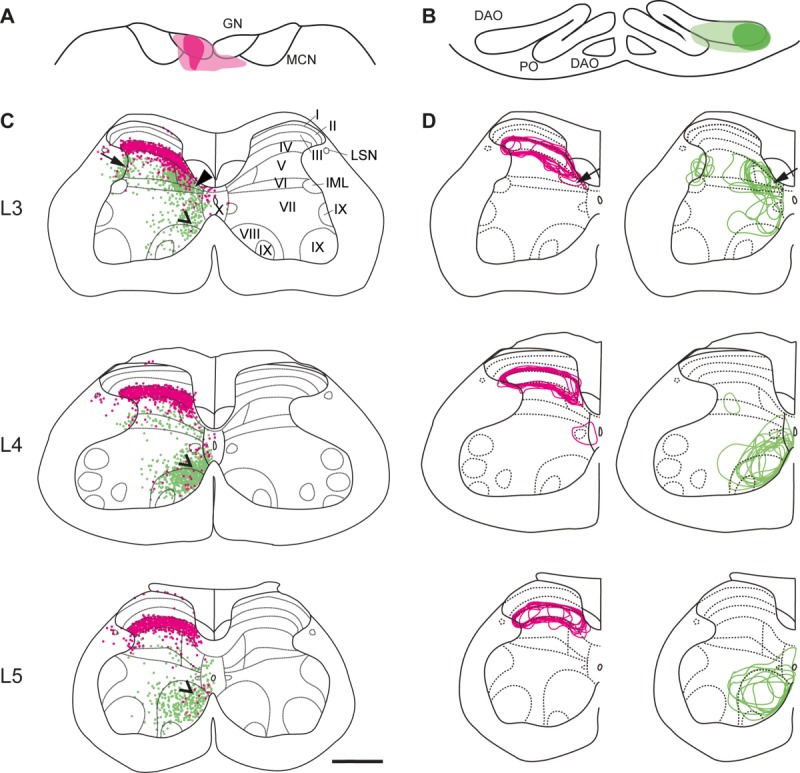
The gracile nucleus (GN) and lateral part of rostral dorsal accessory olive (rDAO) are important relays for indirect, postsynaptic dorsal column, and direct ascending pathways, respectively, that terminate as climbing fibers in the "hindlimb-receiving" parts of the C1 and C3 zones in the cerebellar cortex. While the spinal cells of origin of that project to GN and rDAO are from largely separate territories in the spinal cord, previous studies have indicated that there could be an area of overlap between these two populations in the medial dorsal horn. Given the access of these two ascending tracts to sensory (thalamic) versus sensorimotor (precerebellar) pathways, the present study therefore addresses the important question of whether or not individual neurons have the potential to contribute axons to both ascending pathways. A double-fluorescent tracer strategy was used in rats (red Retrobeads and Fluoro-Ruby or green Retrobeads and Fluoro-Emerald) to map the spatial distribution of cells of origin of the two projections in the lumbar spinal cord. The two pathways were found to receive input from almost entirely separate territories within the lumbar cord (levels L3-L5). GN predominantly receives input from lamina IV, while rDAO receives its input from three cell populations: medial laminae V-VI, lateral lamina V, and medial laminae VII-VIII. Cells that had axons that branched to supply both GN and rDAO represented only about 1% of either single-labeled cell population. Overall, the findings therefore suggest functional independence of the two ascending pathways.
Keywords: cerebellum; gracile; inferior olive; tracer.
Copyright © 2013 Wiley Periodicals, Inc.
Figures


Similar articles
-
Organization of ascending pathways to the forelimb area of the dorsal accessory olive in the cat.J Comp Neurol. 1998 Mar 2;392(1):115-33. J Comp Neurol. 1998. PMID: 9482236
-
Propriospinal neurons with ascending collaterals to the dorsal medulla, the thalamus and the tectum: a retrograde fluorescent double-labeling study of the cervical cord of the rat.Exp Brain Res. 1990;80(3):577-90. doi: 10.1007/BF00227997. Exp Brain Res. 1990. PMID: 2387355
-
Projections of the dorsal column nuclei and the spinal cord on the inferior olive in the cat.J Comp Neurol. 1975 May 15;161(2):215-37. doi: 10.1002/cne.901610206. J Comp Neurol. 1975. PMID: 1055117
-
Projections to the inferior olive of the cat. I. Comparisons of input from the dorsal column nuclei, the lateral cervical nucleus, the spino-olivary pathways, the cerebral cortex and the cerebellum.J Comp Neurol. 1978 Jul 15;180(2):237-51. doi: 10.1002/cne.901800204. J Comp Neurol. 1978. PMID: 659660
-
Homologies of spinal ascending nociceptive pathways between rats and macaques: can we transpose to human? A review and analysis of the literature.Surg Radiol Anat. 2023 Nov;45(11):1443-1460. doi: 10.1007/s00276-023-03212-w. Epub 2023 Jul 28. Surg Radiol Anat. 2023. PMID: 37507602 Review.
Cited by
-
Cerebellar physiology: links between microcircuitry properties and sensorimotor functions.J Physiol. 2017 Jan 1;595(1):11-27. doi: 10.1113/JP272769. Epub 2016 Aug 31. J Physiol. 2017. PMID: 27388692 Free PMC article. Review.
-
Structure of Long-Range Direct and Indirect Spinocerebellar Pathways as Well as Local Spinal Circuits Mediating Proprioception.J Neurosci. 2022 Jan 26;42(4):581-600. doi: 10.1523/JNEUROSCI.2157-20.2021. Epub 2021 Dec 2. J Neurosci. 2022. PMID: 34857649 Free PMC article.
-
The Periaqueductal Gray Orchestrates Sensory and Motor Circuits at Multiple Levels of the Neuraxis.J Neurosci. 2015 Oct 21;35(42):14132-47. doi: 10.1523/JNEUROSCI.0261-15.2015. J Neurosci. 2015. PMID: 26490855 Free PMC article.
References
-
- Abercrombie M. Estimation of nuclear populations from microtome sections. Anat Rec. 1946;94:239–247. - PubMed
-
- Andersson G. Demonstration of a cuneate relay in a cortico-olivo-cerebellar pathway in the cat. Neurosci Lett. 1984;46:47–52. - PubMed
-
- Andersson G, Sjolund B. The ventral spino-olivocerebellar system in the cat. IV. Spinal transmission after administration of clonidine and L-dopa. Exp Brain Res. 1978;33:227–240. - PubMed
-
- Angaut-Petit D. The dorsal column system: I. Existence of long ascending postsynaptic fibers in the cat’s fasciculus gracilis. Exp Brain Res. 1975;22:457–470. - PubMed
-
- Apps R, Garwicz M. Precise matching of olivo-cortical divergence and cortico-nuclear convergence between somatotopically corresponding areas in the medial C1 and medial C3 zones of the paravermal cerebellum. Eur J Neurosci. 2000;12:205–214. - PubMed
Publication types
MeSH terms
Substances
Grants and funding
LinkOut - more resources
Full Text Sources
Other Literature Sources
Miscellaneous
