

Translation elongation can control translation initiation on eukaryotic mRNAs
- PMID: 24357599
- PMCID: PMC3990680
- DOI: 10.1002/embj.201385651
Translation elongation can control translation initiation on eukaryotic mRNAs
Abstract
Synonymous codons encode the same amino acid, but differ in other biophysical properties. The evolutionary selection of codons whose properties are optimal for a cell generates the phenomenon of codon bias. Although recent studies have shown strong effects of codon usage changes on protein expression levels and cellular physiology, no translational control mechanism is known that links codon usage to protein expression levels. Here, we demonstrate a novel translational control mechanism that responds to the speed of ribosome movement immediately after the start codon. High initiation rates are only possible if start codons are liberated sufficiently fast, thus accounting for the observation that fast codons are overrepresented in highly expressed proteins. In contrast, slow codons lead to slow liberation of the start codon by initiating ribosomes, thereby interfering with efficient translation initiation. Codon usage thus evolved as a means to optimise translation on individual mRNAs, as well as global optimisation of ribosome availability.
Figures
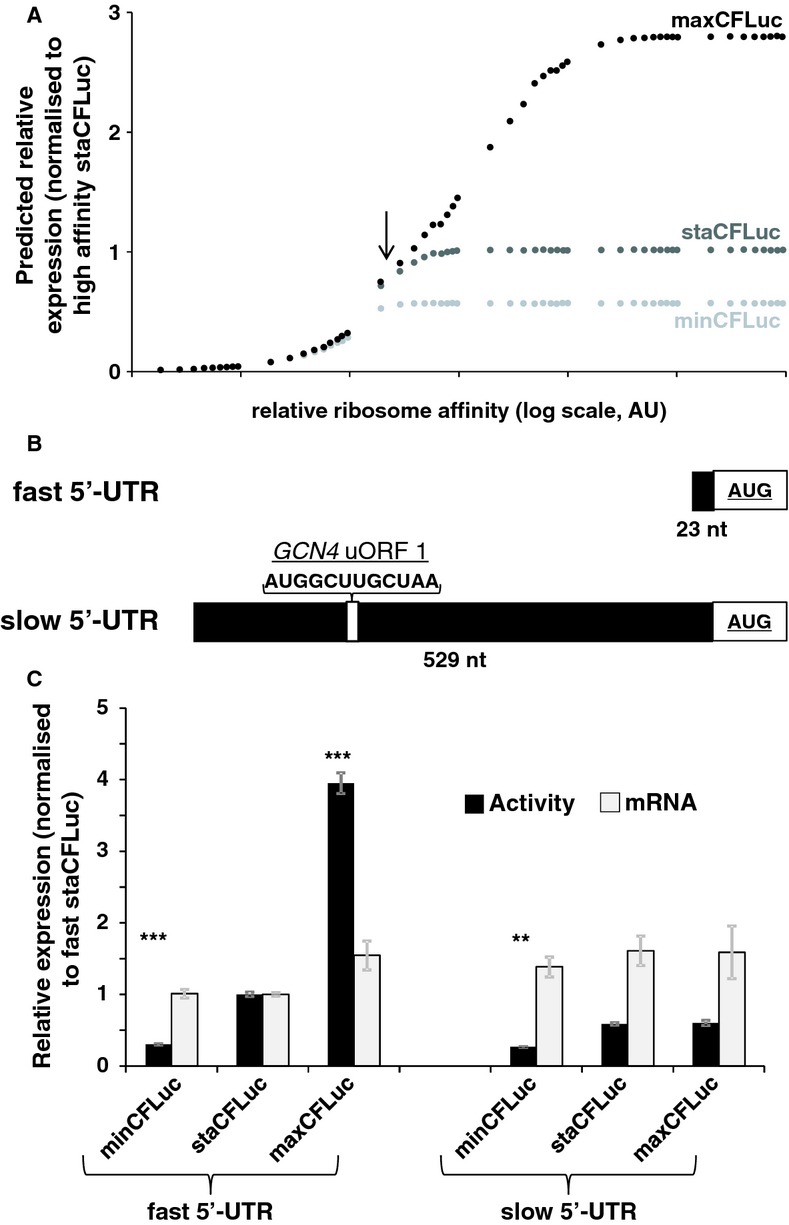
The result of computer simulations predicting protein expression as a function of ribosome affinity. Individual data points indicate the results of a single simulation run. Significant effects of codon usage on expression levels are predicted only at high ribosome affinity, whereas at low ribosome affinity all constructs are expressed at identical levels. The arrow indicates the point where expression levels are most similar to experimental data with the ‘slow’ 5′-UTR in (C).
Experimental manipulation of ribosome affinity on CFLuc expression constructs. Compared to the original construct used to generate data in Figure 1, a ‘slow initiation’ derivative was constructed by introducing a uORF-containing 5′-UTR (derived from the naturally uORF-containing yeast GCN4 leader sequence, from which uORFs 2–4 were deleted).
Comparison of experimentally observed expression levels of fast and slow initiating CFLuc expression constructs, based on observed luciferase activity (black bars) and mRNA levels (light bars). maxCFLuc and staCFLuc express indistinguishable levels of luciferase activity when ribosome arrival rates at the CFLuc start codon are reduced. In contrast, minCFLuc remains lower than the other two variants, and this sequence is not affected by introduction of the slow leader sequence. Error bars denote the standard error of the mean. Statistical significance was tested using Tukey's Test following one-way ANOVA, with parameters for luciferase activity: n = 8, F = 507, P = 0; for mRNA: n = 3, F = 0.74, P = 0.62. Statistical significance of the difference to the comparable sta construct from each group (i.e. comparing fast vs fast and slow vs slow) is indicated by asterisks: *, P < 0.05; **, P < 0.01; ***, P < 0.001, no asterisk, P > 0.05.
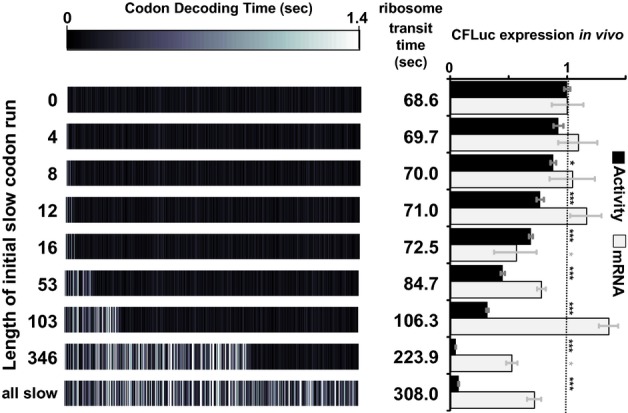
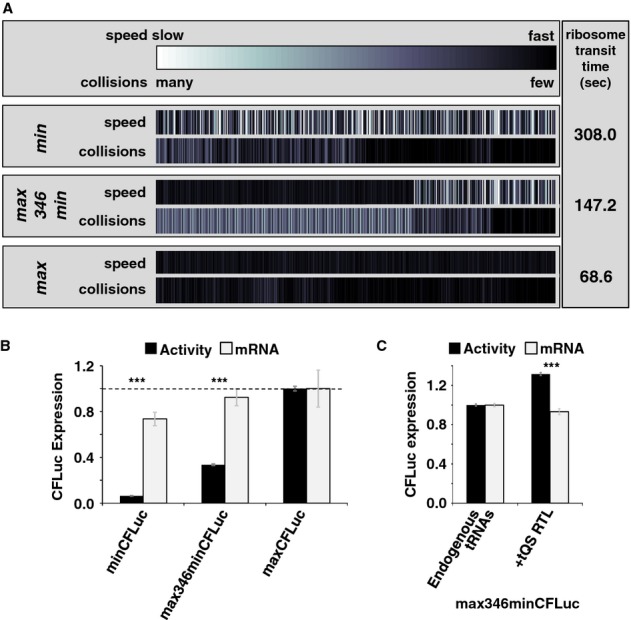
Analyses of the collision behaviour on selected CFLuc variants. Both the speed of codon decoding and the observed number of collisions over each codon are displayed as heat maps. The minCFLuc and maxCFLuc sequences show moderate predicted levels of ribosome collisions, mostly in the 5′-half of the coding sequence preceding regions containing slower codons compared to the overall sequence. In contrast, a max346min construct which consists of 346 fast codons followed by 201 slow codons show high predicted levels of collisions preceding the boundary between the fast and slow sequence portions. Ribosome transit times, calculated as the sum of the mean decoding times for all codons, give the time required by one individual ribosome to translate the respective construct. The transit times of multiple ribosomes under conditions where collisions can occur is expected to be slower than this value.
Experimental results obtained with the expression constructs analysed in (A). The introduction of slow codons into the 3′-end of maxCFLuc significantly reduces luciferase activity, without significantly affecting mRNA levels (as determined by Tukey's Test following one-way ANOVA). ANOVA parameters for luciferase activity are: n = 8, F = 1350, P = 0; for mRNA: n = 5, F = 0.95, P = 0.39. Samples significantly different from maxCFLuc are labelled: ***, P < 0.001; unlabelled, P > 0.05.
The introduction of a plasmid that doubles the gene copy number for the five single-gene encoded essential tRNAs in yeast increases luciferase activity expressed from the mixed construct (n = 16, P = 3 × 10⁻¹⁰, t-test), without significantly affecting mRNA levels (n = 6, P = 0.62, t-test). The ability of tRNAs to affect protein expression levels confirms that expression from this construct is limited by codon usage and not by inadvertently formed RNA secondary structure. ***, P < 0.001; unlabelled, P > 0.05.
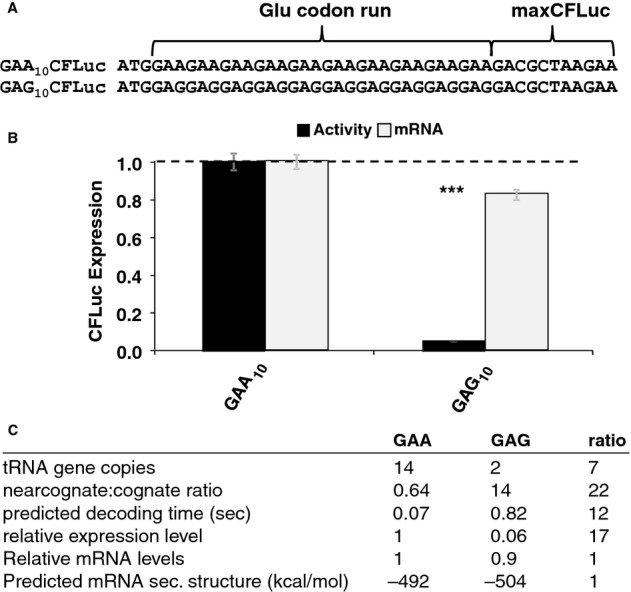
Derivatives of the maxCFLuc construct were created that contain runs of either GAA or GAG codons, both encoding glutamic acid, following the start codon.
The GAG codon run significantly reduces luciferase activity compared to the GAA run (black bars, n = 16, P < 10–12, t-test) while affecting mRNA levels less significantly (light bars, n = 3, P = 0.12, t-test). Error bars indicate the standard error of the mean. Samples significantly different from GAA are labelled: ***, P < 0.001; unlabelled, P > 0.05.
A summary of parameters for the two Glu codon run constructs. There is a good quantitative match between the observed expression levels differences and the predicted codon decoding time, corroborating a model in which different codons are decoded with different speeds in vivo.
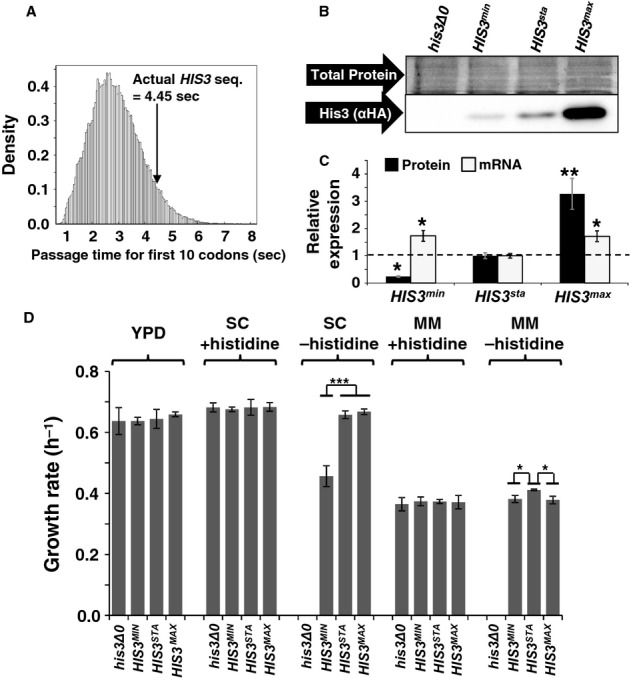
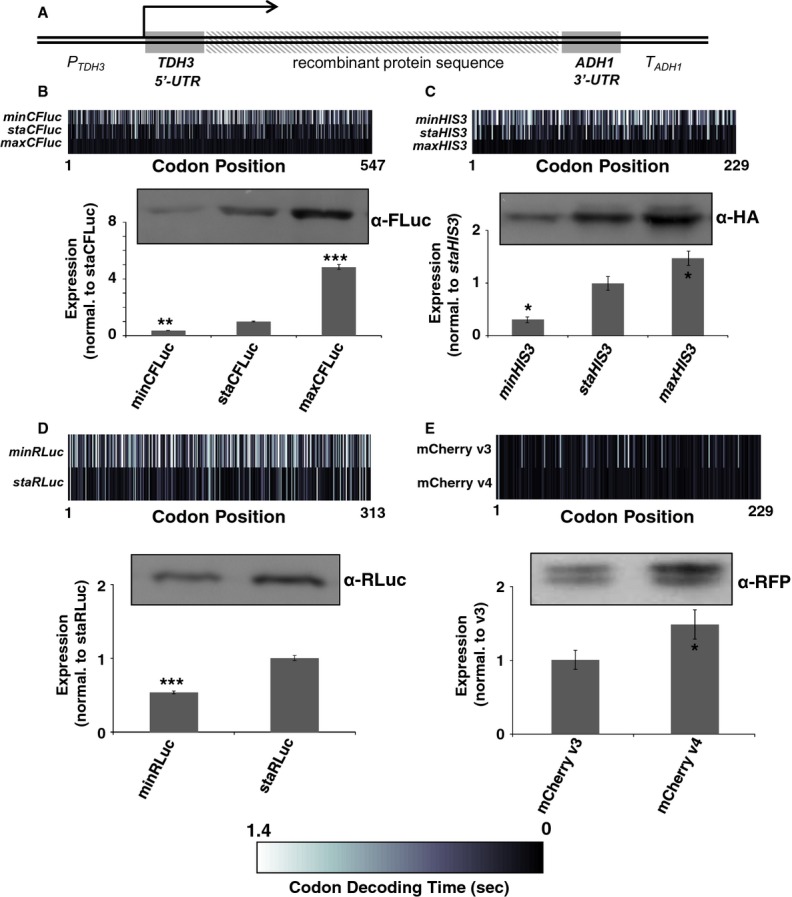
Start codon clearance on yeast HIS3 mRNAs is slow. The histogram shows the speed distribution for the first ten amino acids, for 10 000 randomly generated sequences which produce an amino acid substitution pattern as observed in naturally occurring HIS3 sequences from 73 different budding yeasts. The observed S. cerevisiae HIS3 sequence is slower than 95% of random sequences, indicating that this sequence may have been selected for slow start codon clearance rates.
Natural HIS3 codon usage determines His3 expression levels. HA-tagged HIS3 gene variants were introduced into the yeast genome at the normal chromosomal locus for this gene, maintaining all of its natural control sequences. Protein expression levels were determined using antibodies against the HA-tag located at the His3 C-termini. The top panel shows a section of post-transfer gel stained for total protein as loading control.
Quantification of protein and mRNA expression data for HIS3 codon variants. Error bars show the standard error of the mean. Significance was analysed by Tukey's Test following one-way ANOVA. Protein: n = 3, F = 22.24, P = 0.0017. mRNA: n = 6, F = 5.99, P = 0.012. Statistical significance of differences to the reference sample (sta) is indicated by asterisks (*, P < 0.05; **, P < 0.01).
Media-dependent growth rates of HIS3 derivative strains. In YPD, as well as SC or MM containing histidine, the three HIS3 strains as well as the original his3 deletion strain show indistinguishable growth rates. In contrast, in SC lacking histidine the HIS3min strain growth with reduced rates, whereas in MM lacking histidine the natural codon-usage HIS3sta has a small but significant growth advantage over both the other two strains. Error bars denote the standard error of the mean for growth rates of three independently derived HIS3 integrants. Statistical significance was tested by one-way ANOVA followed by Tukey's Test. ANOVA parameters are: n = 3 for all samples. YPD, F = 0.49, P = 0.70; SC +HIS, F = 0.12, P = 0.95; SC –HIS, F = 90.5, P = 3.3 × 10⁻⁵; MM +HIS, F = 0.18, P = 0.91; MM –HIS, F = 9.85, P = 0.01. Samples significantly different from other samples within their group according to the post-hoc analysis are labelled by asterisks: *, P < 0.05; ***, P < 0.001. Unlabelled bars are not significantly different from other samples within their group.
Comment in
-
Control not at initiation? Bah, humbug!EMBO J. 2014 Jan 7;33(1):3-4. doi: 10.1002/embj.201387388. Epub 2013 Dec 21. EMBO J. 2014. PMID: 24363142 Free PMC article.
References
-
- Aitken CE, Lorsch JR. A mechanistic overview of translation initiation in eukaryotes. Nat Struct Mol Biol. 2012;19:568–576. - PubMed
-
- Anand N, Murthy S, Amann G, Wernick M, Porter LA, Cukier IH, Collins C, Gray JW, Diebold J, Demetrick DJ, Lee JM. Protein elongation factor EEF1A2 is a putative oncogene in ovarian cancer. Nat Genet. 2002;31:301–305. - PubMed
-
- Brachmann CB, Davies A, Cost GJ, Caputo E, Li J, Hieter P, Boeke JD. Designer deletion strains derived from Saccharomyces cerevisiae S288C: a useful set of strains and plasmids for PCR-mediated gene disruption and other applications. Yeast. 1998;14:115–132. - PubMed
-
- Browne GJ, Proud CG. Regulation of peptide-chain elongation in mammalian cells. Eur J Biochem. 2002;269:5360–5368. - PubMed
Publication types
MeSH terms
Substances
LinkOut - more resources
Full Text Sources
Other Literature Sources
Research Materials
