. 2014 Jan;6(1):99-119.
doi: 10.1002/emmm.201302909. Epub 2013 Dec 15.

Prolyl-isomerase Pin1 controls normal and cancer stem cells of the breast

Affiliations

Prolyl-isomerase Pin1 controls normal and cancer stem cells of the breast

Alessandra Rustighi et al. EMBO Mol Med. 2014 Jan.

Erratum in

  • EMBO Mol Med. 2014 May;6(5):702

Abstract

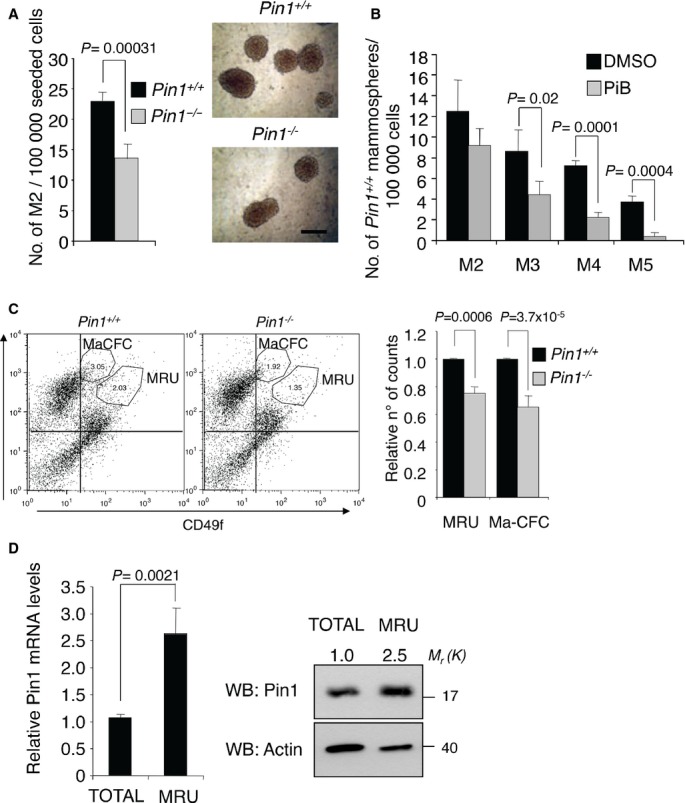
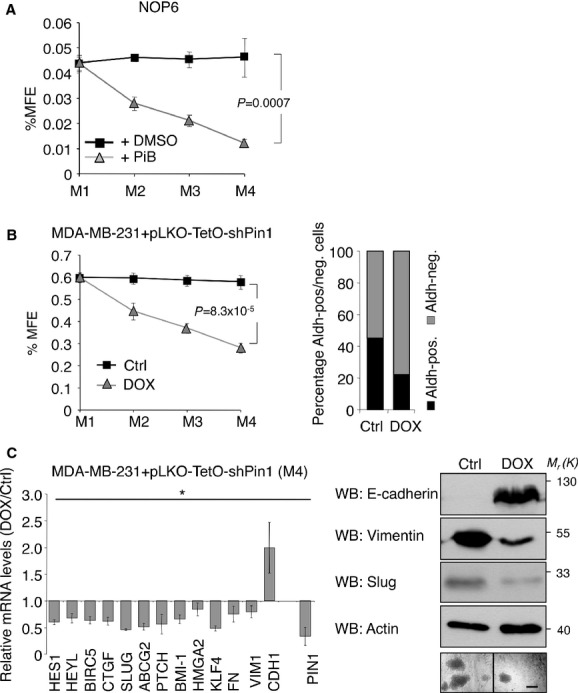
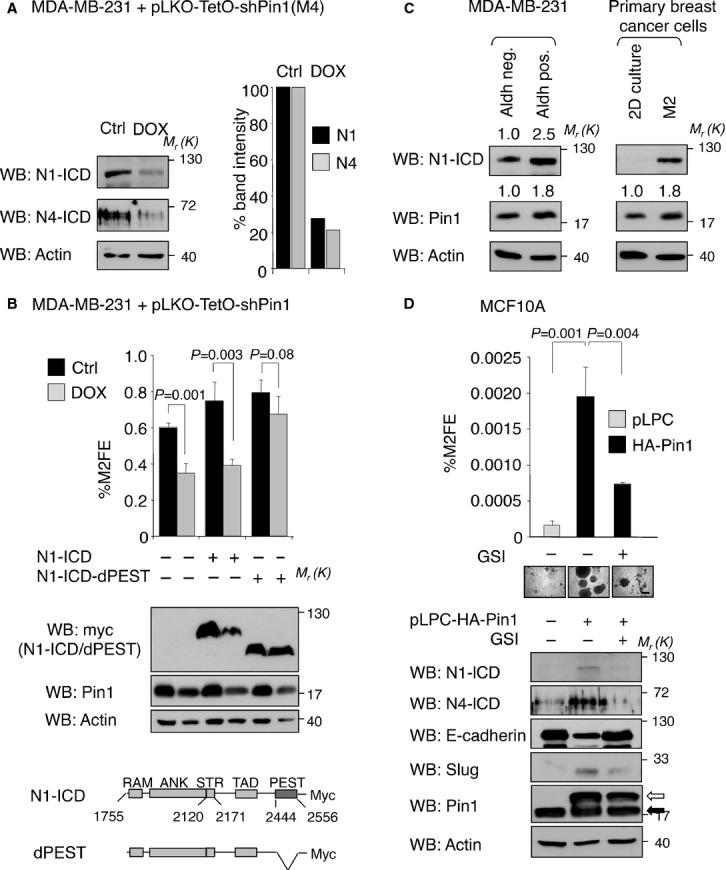
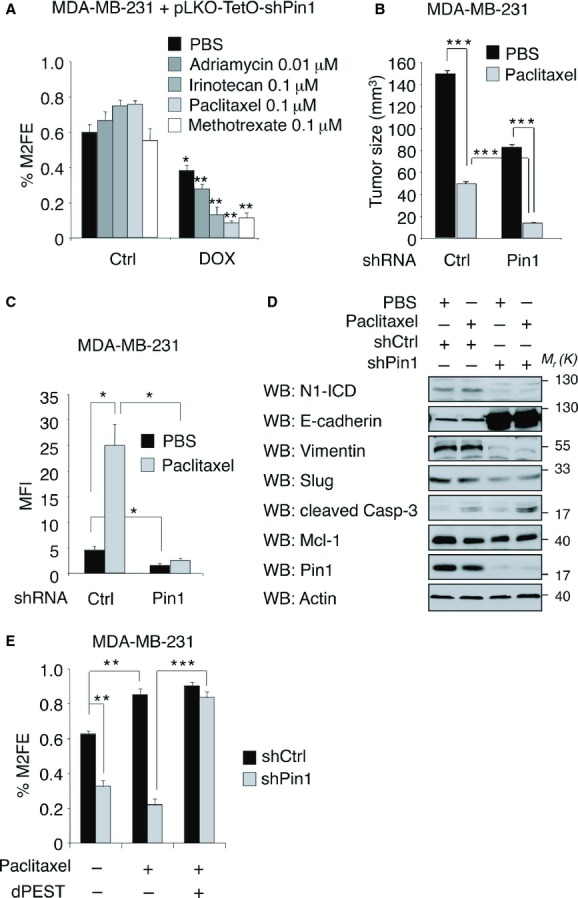
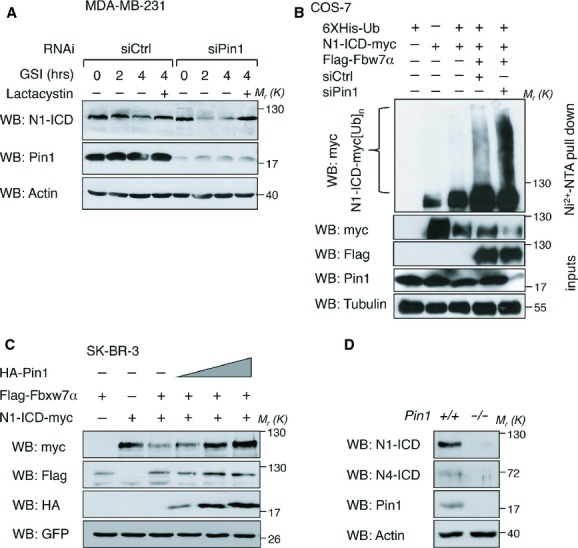
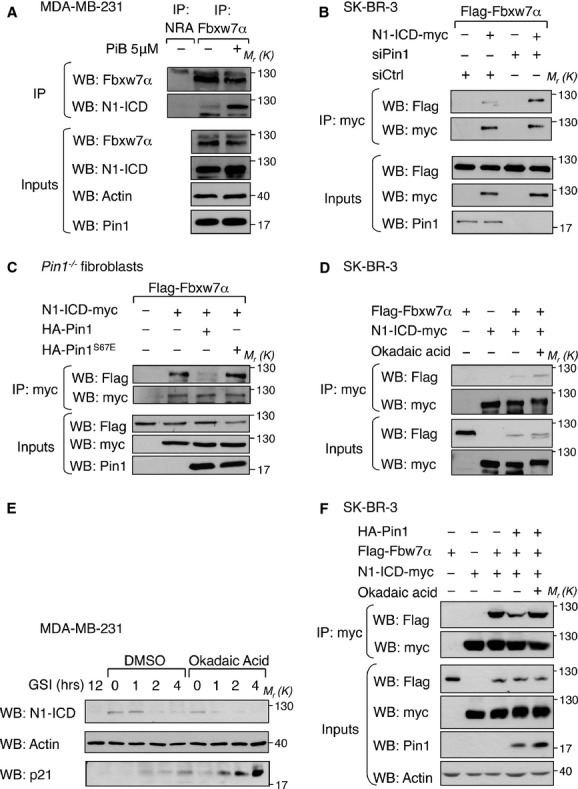
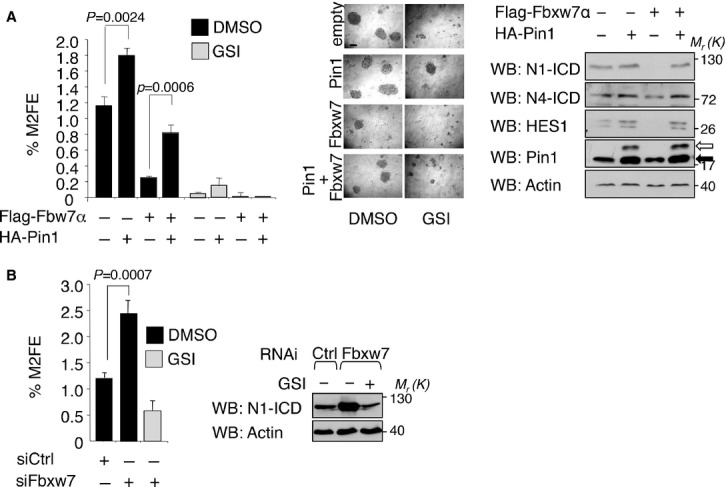
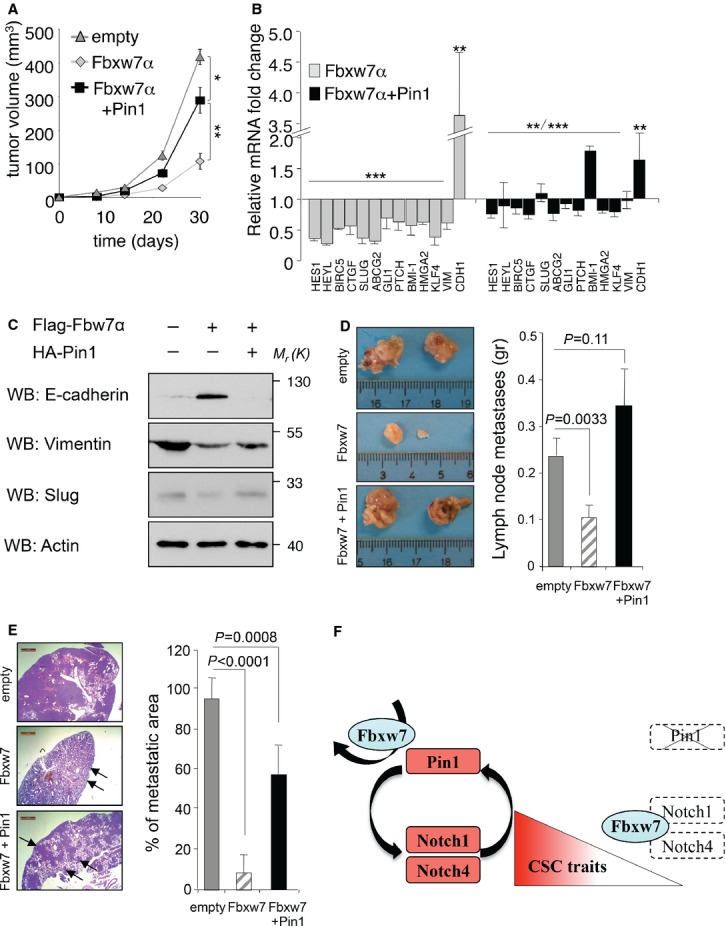
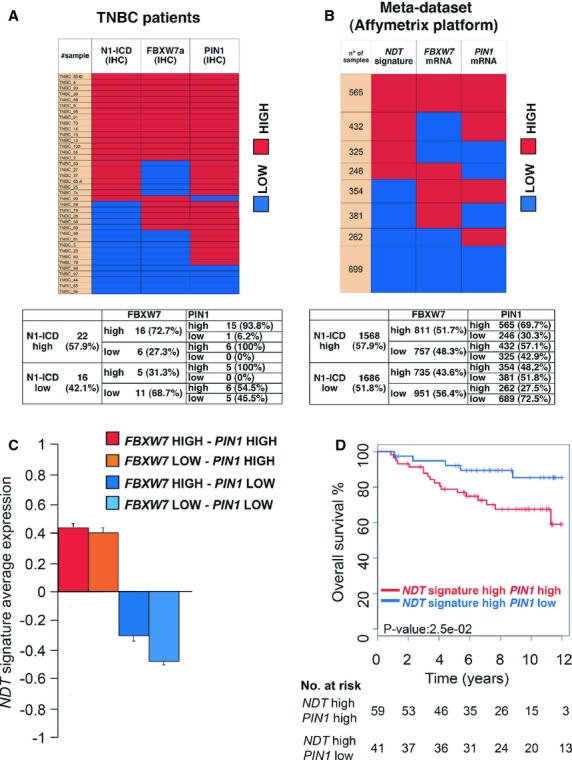
Mammary epithelial stem cells are fundamental to maintain tissue integrity. Cancer stem cells (CSCs) are implicated in both treatment resistance and disease relapse, and the molecular bases of their malignant properties are still poorly understood. Here we show that both normal stem cells and CSCs of the breast are controlled by the prolyl-isomerase Pin1. Mechanistically, following interaction with Pin1, Notch1 and Notch4, key regulators of cell fate, escape from proteasomal degradation by their major ubiquitin-ligase Fbxw7α. Functionally, we show that Fbxw7α acts as an essential negative regulator of breast CSCs' expansion by restraining Notch activity, but the establishment of a Notch/Pin1 active circuitry opposes this effect, thus promoting breast CSCs self-renewal, tumor growth and metastasis in vivo. In human breast cancers, despite Fbxw7α expression, high levels of Pin1 sustain Notch signaling, which correlates with poor prognosis. Suppression of Pin1 holds promise in reverting aggressive phenotypes, through CSC exhaustion as well as recovered drug sensitivity carrying relevant implications for therapy of breast cancers.


Figures

Figure 1
Figure 1
Pin1−/− mice have decreased mammary epithelial stem/progenitor cells. A  Pin1−/− mice display decreased self-renewal of mammary stem cells. Left panel: Number of secondary mammospheres (M2) generated from primary mammary epithelial cells of indicated mice. Means, standard deviations and P-values (t-test, n = 4) are indicated in the histogram. Right panel: representative M2 microscope images with 200 μm scale bar. B  Inhibition of Pin1 affects replicative potential of mammary stem cells. Serial replating of mammospheres (M1–M5) generated from Pin+/+ mice treated with DMSO or PiB (1.5 μM). C  Bipotent stem cell and luminal progenitor number is decreased in Pin1−/− mammary tissue. Left panel: representative FACS analyses of mammary epithelial cells from indicated mice. CD24/CD49f plots and gatings for MRU and Ma-CFC populations are indicated. Right panel: histogram of mean counts of MRU and MA-CFC populations from Pin−/− normalized to Pin1+/+ mice. Means, standard deviations and P-values (t-test, n = 3) are indicated. D  Pin1 mRNA and protein levels are upregulated in the mammary stem cell compartment. Left panel: qRT-PCR of endogenous Pin1 mRNA in MRU sorted populations relative to total population. Means, standard deviations and P-values (t-test, n = 3) are indicated. Right panel: Western blot analysis of the same cell populations as in the left panel. Fold change in Pin1 protein levels determined by Image J software (Rasband, –2012) with respect to actin levels is indicated by a number, Molecular weights in kDa (Mr (K)) are shown on the right.
Figure 2
Figure 2
Pin1 inhibition strongly affects mouse and human mammary CSCs traits. (A) and (B) Means and standard deviations and P-values are indicated (t-test, n = 3, M4). A  Pin1 inhibition decreases self-renewal of mouse mammary tumor cells. Serial replating of mammospheres (M1–M4) generated from NOP6 cells treated with DMSO or PiB (1.5 μM). Mammosphere formation efficiency (%MFE) was calculated as percentage of mammospheres divided by the number of plated cells. B  Pin1 knockdown decreases self-renewal of human breast cancer cells. Left panel: MFE of MDA-MB-231-pLKO-shPin1 control cells (Ctrl) compared to shPin1 induced cells (DOX) upon serial passages. Right panel: Quantification of Aldh-positive and Aldh-negative cells from control- and shPin1 induced M4, as assessed by FACS. C  Pin1 knockdown affects expression of stem cell markers. Left panel: qRT-PCR of the indicated stemness and EMT marker genes from MDA-MB-231-pLKO-shPin1 quaternary mammospheres (M4) upon shPin1 induction (DOX) with respect to control cells (Ctrl). Standard deviations are indicated, P-values * <0.02 (t-test, n = 3). Right panel: Western Blot analysis of EMT markers of the same cells. Molecular weights Mr(K) are indicated in kDa. Representative microphotographs of M4 are shown, 200 μm scale bar is indicated.
Figure 3
Figure 3
Pin1 controls breast CSC self-renewal through N1-ICD stabilization. A  Pin1 depletion causes reduced N1- and N4-ICD protein levels. Left panel: Western Blot analysis of N1- and N4-lCD protein from MDA-MB-231-pLKO-shPin1 M4 control cells (Ctrl) and shPin1 induced cells (DOX). Molecular weights (Mr) are indicated in kDa. Right panel: histogram representing the percentage of band intensity with respect to actin levels. B  Expression of N1-ICD-dPEST stable mutant rescues M2FE following Pin1 depletion. Upper panel: Percentage of secondary mammosphere formation efficiency (%M2FE) of control (Ctrl, black bars) or Pin1 silenced (DOX, grey bars) cells, transduced with empty (–), N1-ICD or N1-ICD-dPEST vectors (+). Means, standard deviations and P-values (t-test, n = 3) are indicated. Middle panel: Western blot analysis of the indicated proteins from cells grown as M2. Lower panel: Scheme of protein domains of overexpressed N1-ICD forms. Numbering refers to Swissprot entry P46531. C  Pin1 and N1-ICD levels are upregulated in the breast CSC compartment. Comparative Western blot analyses of Aldh-positive (stem) versus Aldh-negative cells (non-stem) sorted from MDA-MB-231 M2 (left panel) and patient-derived breast cancer secondary M2 mammospheres (stem) versus cells cultured in adherence (2D) (right panel). Relative fold change in Pin1 or N1-ICD protein levels determined by Image J software with respect to actin levels is indicated by a number. D  Pin1 overexpression promotes stem cell phenotypes through regulation of the Notch pathway. Upper panel: %M2FE of MCF10A breast epithelial cells transduced with empty (pLPC) or HA-Pin1 overexpressing vectors (pLPC-HA-Pin1) and treated with DMSO (–) or 10 μM GSI. Means, standard deviations and P-values (t-test, n = 3) are indicated. Middle panel: Representative microphotographs of M2 are shown, scale bar of 200 μm is indicated. Lower panel: Western Blot of cell lysates from corresponding MCF10A clones. White and black arrows indicate over-expressed and endogenous Pin1, respectively.
Figure 4
Figure 4
Pin1 downmodulation sensitizes breast CSCs to chemotherapeutic treatment in vitro and in vivo. A  Pin1 knockdown synergizes with chemotherapy treatment to block breast CSCs' self-renewal. Percentage of M2FE of control MDA-MB-231-pLKO-shPin1 cells (Ctrl) compared to shPin1-induced cells (DOX) treated with indicated drugs or PBS. Means and standard deviations are indicated, P-values are * = 0.001, **< 0.0003 (t-test, n = 3). B  Pin1 knockdown synergizes with paclitaxel to block breast cancer growth. Tumor growth of MDA-MB-231 xenografts espressing the indicated shRNAs and treated with paclitaxel (grey bars) or left untreated (PBS) (black bars). Means and standard deviations are indicated, P-values are *** < 0.0003 (t-test, n = 12). C  Pin1 knockdown blocks chemotherapy-induced breast CSCs' expansion in vivo. Histogram representing the Aldefluor mean fluorescent intensity (MFI) of cells from control- and shPin1 MDA-MB-231 xenografts treated with Paclitaxel or PBS. Means and standard deviations are indicated, P-values are * = 0.001 (t-test, n = 3 for each condition). D  Pin1 knockdown induces reversal of EMT and cell death in breast cancer xenografts in combination with paclitaxel. Western blot analyses of tumor xenografts from (B). E  Expression of stable N1-ICD-dPEST rescues resistance to paclitaxel treatment in Pin1 silenced cells. Percentage of M2FE of control (black bars) or Pin1 shRNA (grey bars) expressing MDA-MB-231 cells transduced with empty (–) or N1-ICD-dPEST (+) expressing vectors, treated with Paclitaxel (+) or PBS (–). Means and standard deviations are indicated, P-values are **0.0001, ***<0.00003 (t-test, n = 3).
Figure 5
Figure 5
Pin1 rescues N1- and N4-ICD from Fbxw7α-mediated proteasome-dependent degradation. Molecular weights (Mr) are indicated in kDa. A  Pin1 knockdown accelerates the decay of endogenous N1-ICD. Western blot of endogenous N1-ICD following RNA interference (RNAi) with the indicated siRNAs and time points following GSI or GSI plus Lactacystin (+) chase is shown. B  Pin1 depletion enhances Fbxw7α-dependent poly-ubiquitination of N1-ICD. Western blot analysis of high molecular weight N1-ICD-myc products (N1-ICD-myc[Ub]n) from a Ni-NTA pull-down in COS-7 cells transfected with the indicated vectors along with control- or Pin1 siRNA. Input levels of over-expressed proteins are shown. C  Pin1 overexpression rescues N1-ICD levels in presence of Fbxw7α. Western blot analysis of lysates from SK-BR-3 cells over-expressing N1-ICD-myc, Flag-Fbxw7α along with empty (–) or increasing amounts of HA-Pin1 expressing vector, normalized for co-expressed GFP protein. D  Pin1−/− mammary epithelial cells have impaired Notch pathway activation. Western blot analyses of primary MECs from indicated female mice.
Figure 6
Figure 6
Pin1 controls N1-ICD half-life by uncoupling it from Fbxw7α. Experiments in (A)-(D) and (F) were performed in presence of proteasome inhibitor to avoid misinterpretation of binding results due to protein degradation. (A–F) Molecular weights (Mr) are indicated in kDa. A  Inhibition of Pin1 increases interaction between endogenous Fbxw7α and N1-ICD proteins. Western blot analysis of co-immunoprecipitation (Co-IP) experiments between endogenous Fbxw7α and N1-ICD from MDA-MB-231 cells treated with DMSO (–) or PiB (+). Anti-Fbxw7α or non related antibody (NRA) immunoprecipitates (IP) were recognized with anti-N1-ICD (Val1744) antibody and after stripping with an anti-Fbxw7α antibody. Input levels are shown below. B  Depletion of Pin1 increases Fbxw7α-N1-ICD interaction. Representative Western blot analysis of Co-IP experiments between over-expressed N1-ICD-myc and Flag-Fbxw7α in SK-BR-3 cells. Over-expressed N1-ICD-myc was immunoprecipitated (IP) and subjected to anti-Flag Western Blot to reveal Flag-Fbxw7α Co-IP. Input levels of over-expressed or silenced proteins are shown below. C  Pin1 catalytic activity is required to uncouple N1-ICD from Fbxw7α. Co-IP as in (B) in Pin1−/− embryo fibroblasts transduced with the indicated vectors. D  Inhibition of PP2A enforces Fbxw7α-N1-ICD interaction. Co-IP as above in SK-BR-3 cells treated with DMSO (–) or okadaic acid and transduced with the indicated vectors. E  Inhibition of PP2A accelerates the half-life of endogenous N1-ICD. Western blot analysis of a GSI chase of MDA-MB-231 cells treated with vehicle (DMSO) or okadaic acid. Anti-p21Cip1Waf1 immunoblot was added as control for Okadaic acid functioning (Park et al, 2001). F  PP2A is required for Pin1-dependent N1-ICD detachment from Fbxw7α. Co-IP as above in SK-BR-3 cells transduced with the indicated vectors and treated with DMSO (–) or okadaic acid.
Figure 7
Figure 7
Pin1 and Fbxw7α modulate N1-ICD stem cell activity in vitro. A  Fbxw7α overexpression reduces breast CSCs self-renewal. Left panel: %M2FE of MDA-MB-231 cells overexpressing the indicated vectors. Black and grey bars indicate DMSO or GSI treated mammospheres, respectively. Means, standard deviations and P-values (t-test, n = 3), are indicated. Middle panel: Representative microphotographs of M2 are shown, 200 μm scale bar is indicated. Right panel: Western Blot of cell lysates from M2. White and black arrows indicate over-expressed and endogenous Pin1, respectively. B  Fbxw7α genetic ablation increases breast CSCs' self-renewal in a Notch-dependent manner. Left panel: Histogram showing %M2FE of MDA-MB-231 cells with indicated siRNA and treated with vehicle (black bars) or GSI (grey bars). Means, standard deviations and P-values (t-test, n = 3), are indicated. Right panel: Western Blot of cell lysates from M2. Molecular weights (Mr) are indicated in kDa.
Figure 8
Figure 8
Pin1 and Fbxw7α modulate N1-ICD stem cell activity in vivo. (A), (B) and (D), (E) Means, standard errors of the mean and P-values (t-test, n = 6), are indicated. (C) Molecular weights Mr(K) are indicated in kDa. A  Pin1 rescues tumor growth in Fbxw7 overexpressing xenografts. Tumor volume of orthotopic xenografts in SCID mice obtained from the indicated MDA-MB-231 cell clones. B   Pin1 rescues stem cell marker expression in Fbxw7 overexpressing xenografts. qRT-PCR of Fbxw7α and Fbxw7α + Pin1 tumor xenografts relative to control tumors (empty) explanted at the end of the experiment. C   Pin1 recovers EMT marker expression in Fbxw7 overexpressing xenografts. Western blot analyses of the indicated proteins from the same tumor xenografts as in (A). D,E  Pin1 rescues metastasis formation of Fbxw7 overexpressing primary tumors. Comparison of lymph node and pulmonary metastases growth derived from the above xenografts, respectively. Representative images of colonized lymph nodes (D) and hematoxylin and eosin stained pulmonary sections (E) are shown. Rulers and Scale bars (1 mm) are indicated for calibration, arrows indicate metastatic areas. F  Schematic representation summarizing the role of Pin1 in sustaining CSCs through Notch1 and Notch4 by antagonizing Fbxw7α-mediated destruction.
Figure 9
Figure 9
High N1-ICD levels in human breast cancers coexist with Fbxw7 thanks to high Pin1 expression. A  Immunohistochemical analysis of the indicated proteins in a panel of 38 triple negative breast cancer samples. Upper panel: heatmap representing the protein levels of Pin1, Fbxw7α and N1-ICD in a cohort of 38 breast cancer patients. The colors represent high (red) or low (blue) protein levels according to protein expression scores (see supplementary Methods). Lower panel: Contingency table showing percentage of each category calculated on the precedent category of patients; chi-square test was performed for independence between the variables and the P-value = 10–5. B  NDT expression analysis in a Meta-dataset of 3254 breast cancer patients. Upper panel: heatmap representing the contingency table frequencies of samples classified as having high or low levels of FBXW7, of PIN1 and of the NDT gene signature. Number of samples in each category is indicated on the left. The association among high levels of NDT gene signature, PIN1, and FBXW7 resulted statistically significant (< 0.001; chi-square test). Lower panel: Contingency table showing percentage of each category calculated on the precedent category of patients. C  Expression correlation between NDT and PIN1 and FBXW7 mRNA levels. Average expression of NDT gene signature in breast cancer samples stratified according to high or low expression of PIN1 and FBXW7 mRNA. Data are shown as mean ± standard error of the mean (s.e.m.). D  Survival analysis of Grade 3 high NDT expressing patients in function of PIN1 expression. Kaplan–Meier survival curve is indicated for high NDT signature, grade 3 breast cancer patients of the metadataset in function of high or low PIN1 mRNA levels. P-value and the number of subjects at risk at each time point is indicated below.

References

    1. Adorno M, Cordenonsi M, Montagner M, Dupont S, Wong C, Hann B, Solari A, Bobisse S, Rondina MB, Guzzardo V, et al. A Mutant-p53/Smad complex opposes p63 to empower TGFbeta-induced metastasis. Cell. 2009;137:87–98. - PubMed
    1. Al-Hajj M, Wicha MS, Benito-Hernandez A, Morrison SJ, Clarke MF. Prospective identification of tumorigenic breast cancer cells. Proc Natl Acad Sci USA. 2003;100:3983–3988. - PMC - PubMed
    1. Atchison FW, Means AR. A role for Pin1 in mammalian germ cell development and spermatogenesis. Front Biosci. 2004;9:3248–3256. - PubMed
    1. Ben-Porath I, Thomson MW, Carey VJ, Ge R, Bell GW, Regev A, Weinberg RA. An embryonic stem cell-like gene expression signature in poorly differentiated aggressive human tumors. Nat Genet. 2008;40:499–507. - PMC - PubMed
    1. Beverly LJ, Felsher DW, Capobianco AJ. Suppression of p53 by Notch in Lymphomagenesis: implications for initiation and regression. Cancer Res. 2005;65:7159–7168. - PubMed

Publication types

MeSH terms