. 2014 Feb;45(2):571-8.
doi: 10.1161/STROKEAHA.113.002944. Epub 2013 Dec 19.

Perfusion of ischemic brain in young and aged animals: a laser speckle flowmetry study

Affiliations

Perfusion of ischemic brain in young and aged animals: a laser speckle flowmetry study

Bharti Manwani et al. Stroke. 2014 Feb.

Abstract

Background and purpose: Aging is an important determinant of ischemic stroke outcomes. Both clinical and experimental stroke studies have shown that aging negatively correlates with infarct volumes but is associated with worsened functional recovery after stroke. This may correspond to a differing cellular and molecular response to stroke in the aged versus young brain. It was hypothesized in this study that the smaller injury seen in the aged ischemic brain is because of structural differences in microvasculature with aging or differences in intraischemic tissue perfusion.

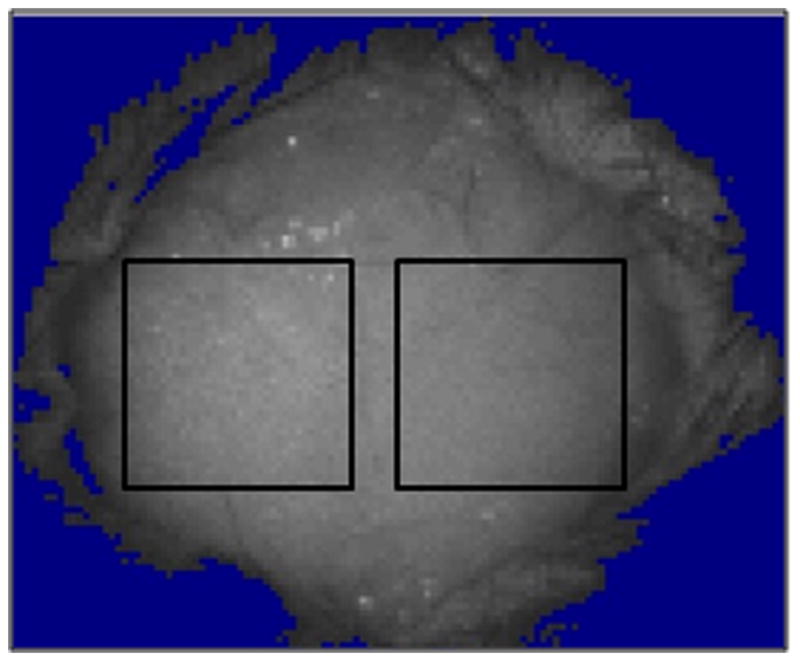
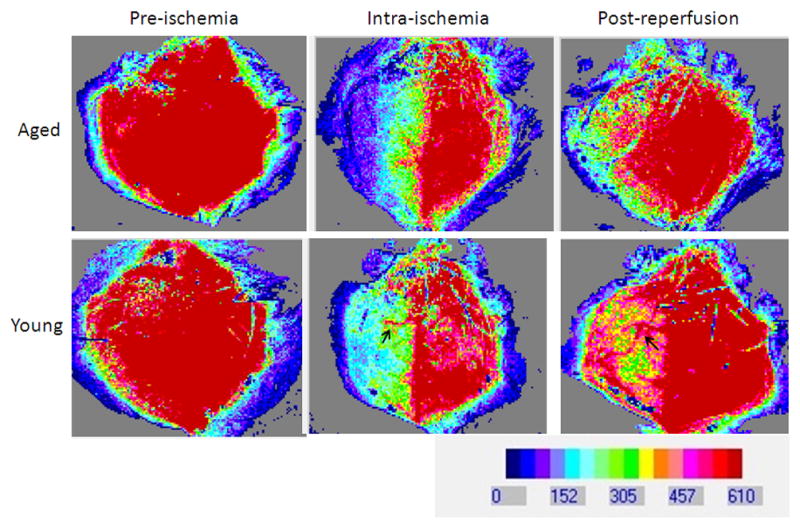
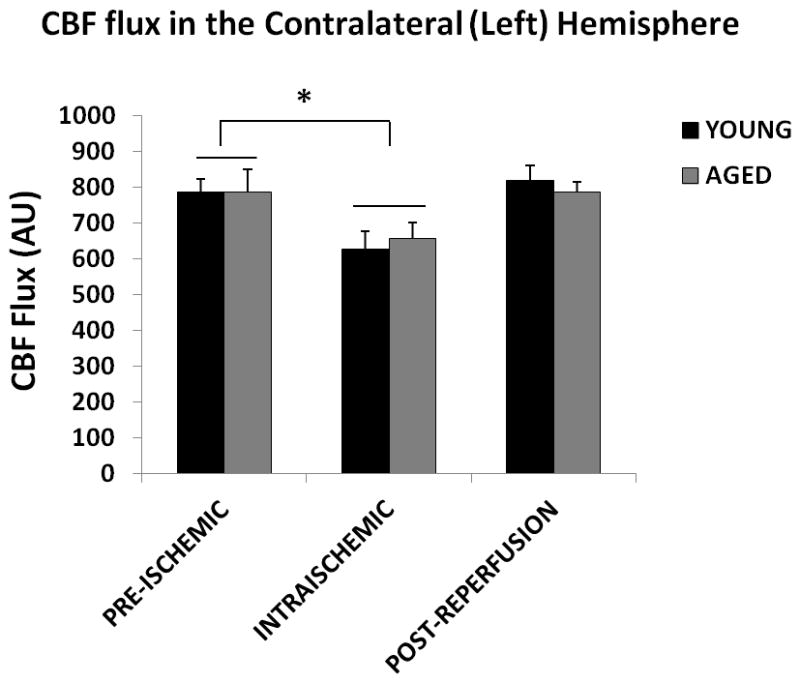
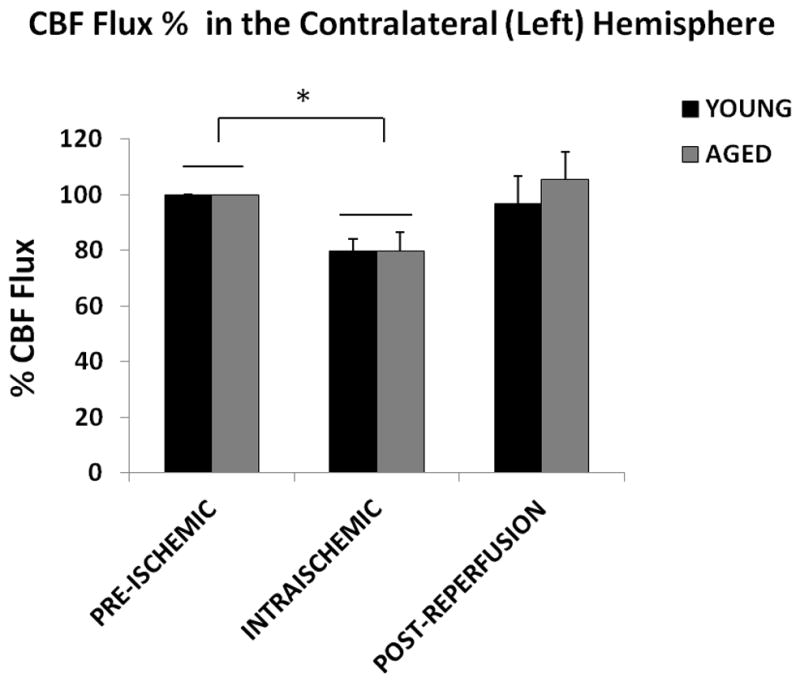
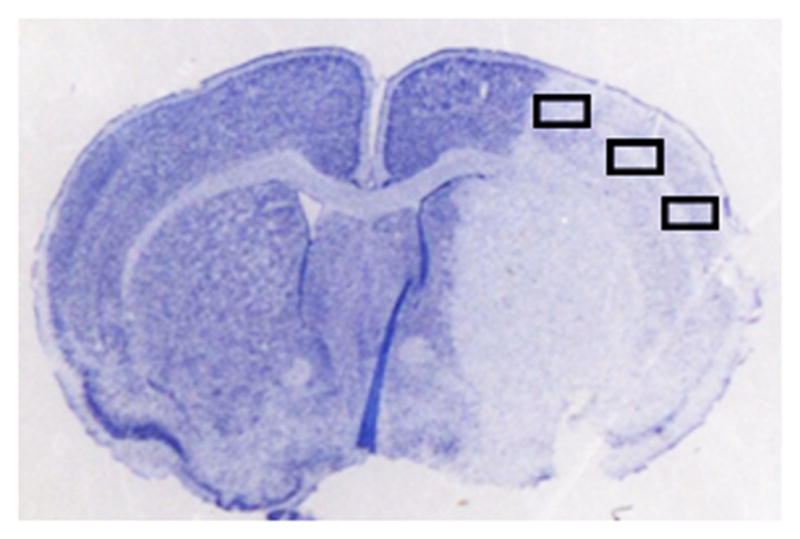
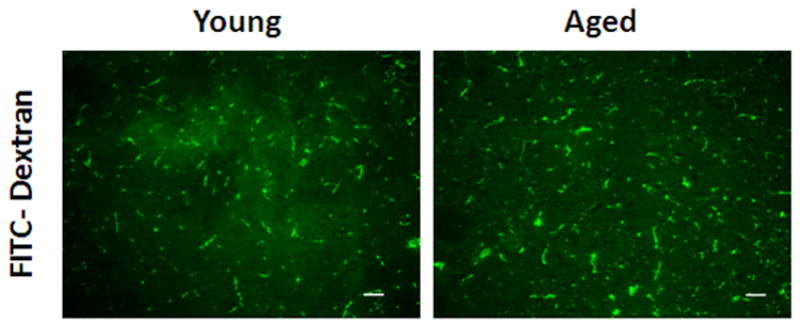
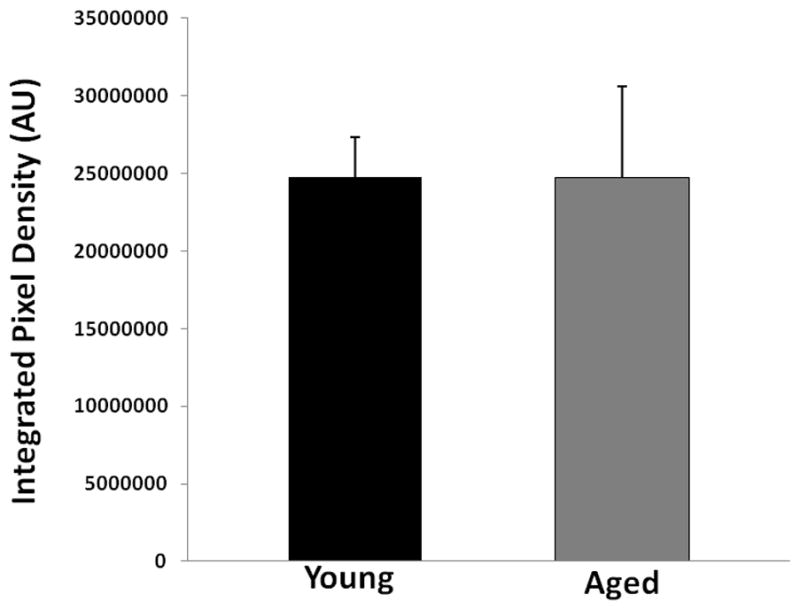
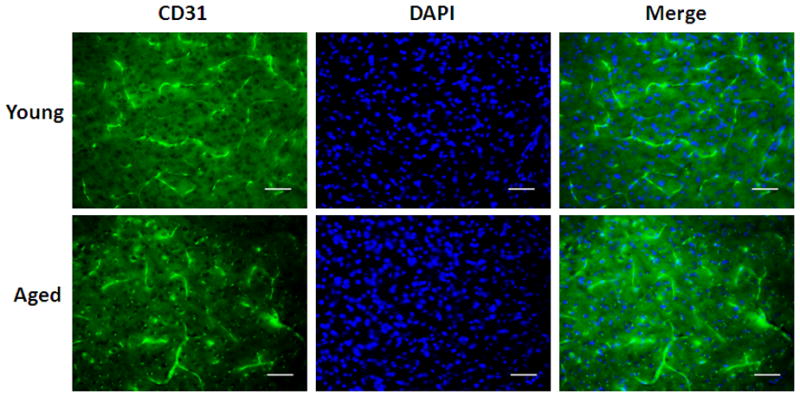
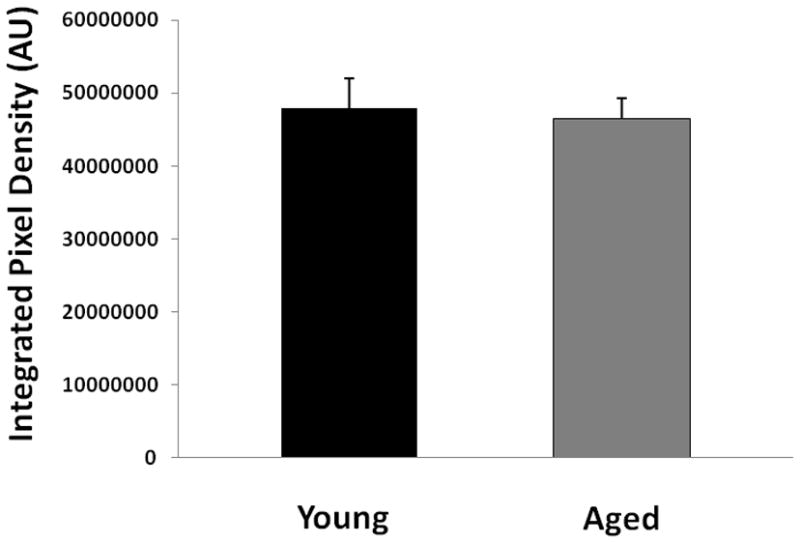
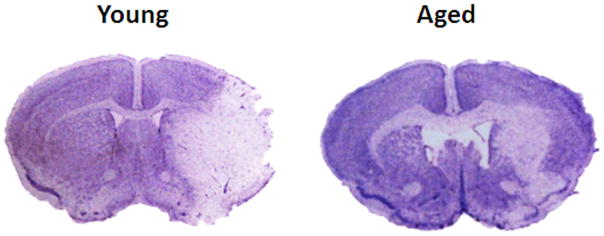
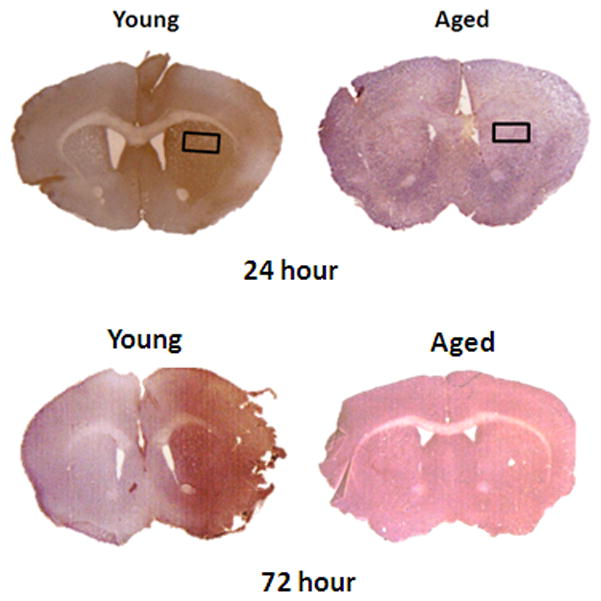
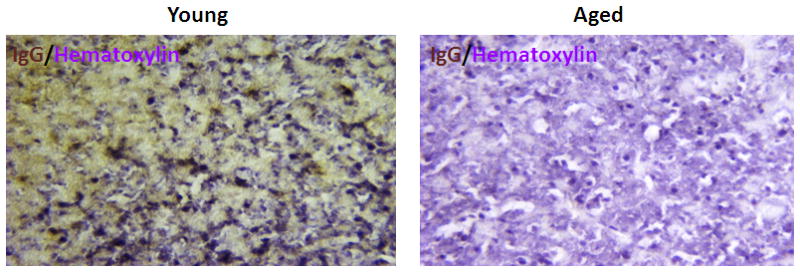
Methods: Both young and aged C57BL6 mice were subject to middle cerebral artery occlusion modeling. Laser speckle flowmetry was used to study the functional dynamics of cerebral perfusion, and fluorescein isothiocyanate (FITC)-dextran staining was performed to examine the structural change in microvasculature. In separate cohorts, cresyl violet staining and immunohistochemistry with CD31 and IgG antibodies were applied to further assess the microvascular density and blood-brain barrier breakdown after stroke.

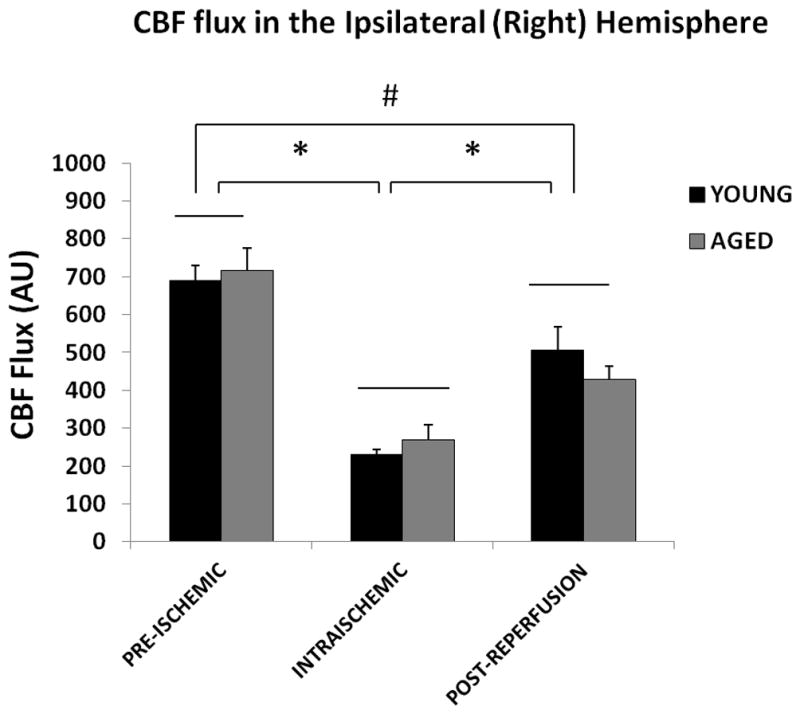
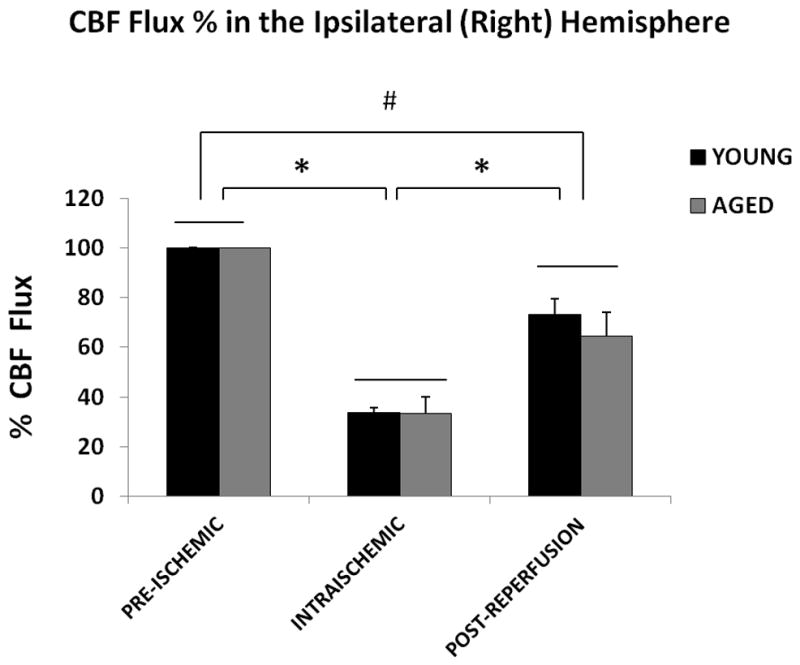
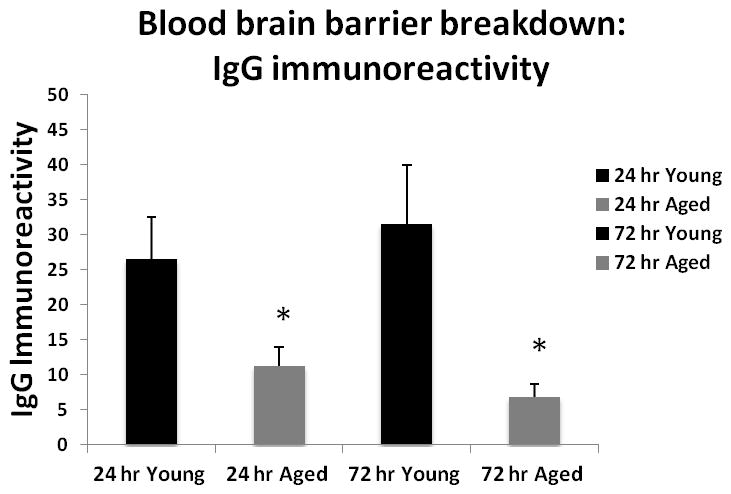
Results: No difference in cerebral blood flow was seen at the baseline, intraischemically, and postreperfusion in young versus aged mice. FITC-dextran and CD31 staining did not show significant differences in the microvascular density between young and aged ischemic brains. More extravasation of IgG through the blood-brain barrier was found in the young versus aged cohort at both 24 and 72 hours after stroke.

Conclusions: Cerebrovascular dynamics and perfusion are not responsible for the different stroke phenotypes seen in the young versus aged animals, which may be more related to different levels of blood-brain barrier breakdown.

Keywords: aging; brain ischemia; infarction; microcirculation; middle cerebral artery occlusion; perfusion; regional blood flow.


Conflict of interest statement

Conflict of Interest: The authors declare that there are no conflicts of interest.

Figures

Figure 1
Figure 1
LSF images in the brain after stroke. (A). The two rectangular boxes indicate regions of interest (ROI) selected for measurement on the exposed skull of the mice. (B). LSF flux images (perfusion images) showing CBF pre-ischemia, intra-ischemia and post-reperfusion in young versus aged mice. No difference in CBF was noted in young vs. aged animals at the baseline (pre-ischemia), intra-ischemically and post-reperfusion. Post MCAO the ipsilateral side (right side) shows a reduction in CBF and post reperfusion the CBF is restored. The arrow in Young/Intra-ischemia indicates occluded blood vessel. The arrow in Young/Post-reperfusion shows release of obstruction and blood flow through that vessel. Red color, high CBF; blue color, low CBF.
Figure 1
Figure 1
LSF images in the brain after stroke. (A). The two rectangular boxes indicate regions of interest (ROI) selected for measurement on the exposed skull of the mice. (B). LSF flux images (perfusion images) showing CBF pre-ischemia, intra-ischemia and post-reperfusion in young versus aged mice. No difference in CBF was noted in young vs. aged animals at the baseline (pre-ischemia), intra-ischemically and post-reperfusion. Post MCAO the ipsilateral side (right side) shows a reduction in CBF and post reperfusion the CBF is restored. The arrow in Young/Intra-ischemia indicates occluded blood vessel. The arrow in Young/Post-reperfusion shows release of obstruction and blood flow through that vessel. Red color, high CBF; blue color, low CBF.
Figure 2
Figure 2
CBF flux in the ipsilateral hemisphere. (A) Flux in young vs. aged mice in the ipsilateral (right) hemisphere. No significant difference was seen in the CBF flux in young vs. aged mice pre-ischemically, intraischemically or post-reperfusion. The CBF flux significantly decreased after MCAO, and was recovered after reperfusion, *p<0.05. (B) CBF Flux % in young vs. aged mice in the ipsilateral (right) hemisphere. No significant difference was seen in the CBF flux in young vs. aged mice pre-ischemically, intra-ischemically or post-reperfusion. The CBF flux% significantly decreases after MCAO, and was recovered after reperfusion, *p<0.05.
Figure 2
Figure 2
CBF flux in the ipsilateral hemisphere. (A) Flux in young vs. aged mice in the ipsilateral (right) hemisphere. No significant difference was seen in the CBF flux in young vs. aged mice pre-ischemically, intraischemically or post-reperfusion. The CBF flux significantly decreased after MCAO, and was recovered after reperfusion, *p<0.05. (B) CBF Flux % in young vs. aged mice in the ipsilateral (right) hemisphere. No significant difference was seen in the CBF flux in young vs. aged mice pre-ischemically, intra-ischemically or post-reperfusion. The CBF flux% significantly decreases after MCAO, and was recovered after reperfusion, *p<0.05.
Figure 3
Figure 3. CBF flux in the contralateral hemisphere
(A) Flux in young vs. aged mice in the contralateral (left) hemisphere. No significant difference was seen in the CBF flux in young vs. aged mice in the contralateral hemisphere pre-ischemically, intra-ischemically or post-reperfusion. The CBF flux significantly decreases after MCAO, *p<0.05. (B) Flux % in young vs. aged mice in the contralateral (left) hemisphere. No significant difference was seen in the CBF flux in young vs. aged mice in the contralateral hemisphere, pre-ischemically, intra-ischemically or post-reperfusion. The CBF flux% significantly decreased after MCAO, *p<0.05.
Figure 4
Figure 4
FITC-dextran (150kd) staining of young vs. aged mice 24 hours after MCAO. (A) A representative TTC picture showing all IHC images were taken in the boxed areas. (B) Representative FITC-dextran staining pictures (10x). Scale bar = 50 μm. (C) Integrated vascular density in young vs. aged mouse brain sections 24 hours after MCAO. No significant difference in the integrated pixel density was seen in young vs. aged mice.
Figure 4
Figure 4
FITC-dextran (150kd) staining of young vs. aged mice 24 hours after MCAO. (A) A representative TTC picture showing all IHC images were taken in the boxed areas. (B) Representative FITC-dextran staining pictures (10x). Scale bar = 50 μm. (C) Integrated vascular density in young vs. aged mouse brain sections 24 hours after MCAO. No significant difference in the integrated pixel density was seen in young vs. aged mice.
Figure 5
Figure 5
CD31 staining of young vs. aged mice 24 hours after MCAO. (A) Representative FITC-dextran staining pictures (20x). Scale bar = 50 μm. (B) Integrated vascular density in young vs. aged mouse brain sections 24 hours after MCAO. There was no significant difference in the integrated pixel density of young vs. aged mice.
Figure 5
Figure 5
CD31 staining of young vs. aged mice 24 hours after MCAO. (A) Representative FITC-dextran staining pictures (20x). Scale bar = 50 μm. (B) Integrated vascular density in young vs. aged mouse brain sections 24 hours after MCAO. There was no significant difference in the integrated pixel density of young vs. aged mice.
Figure 6
Figure 6
Cresyl violet and IgG staining (Hematoxylin counterstain) in young vs. aged brain sections 24 hrs after MCAO. (A) Representative CV staining pictures showing young brains had larger infarct volumes (white) than aged brains. (B) Representative IgG staining pictures showing young brains had higher IgG immunoreactivity (brown) than aged brains at 24 and 72 hours endpoint. (C) Microscopic images (20x) of IgG staining in young vs. aged brains. Pictures are taken from the area marked with a box in (B). Brown shows the IgG staining. Blue is the counterstain with hematoxylin. (D) Quantification of IgG immunoreactivity shown in 6B, 6C. Young brain shows higher IgG immunoreactivity (brown) than the aged at both 24 and 72 hours after MCAO, *p<0.05 vs. young group (n=6 young, n=5 aged).
Figure 6
Figure 6
Cresyl violet and IgG staining (Hematoxylin counterstain) in young vs. aged brain sections 24 hrs after MCAO. (A) Representative CV staining pictures showing young brains had larger infarct volumes (white) than aged brains. (B) Representative IgG staining pictures showing young brains had higher IgG immunoreactivity (brown) than aged brains at 24 and 72 hours endpoint. (C) Microscopic images (20x) of IgG staining in young vs. aged brains. Pictures are taken from the area marked with a box in (B). Brown shows the IgG staining. Blue is the counterstain with hematoxylin. (D) Quantification of IgG immunoreactivity shown in 6B, 6C. Young brain shows higher IgG immunoreactivity (brown) than the aged at both 24 and 72 hours after MCAO, *p<0.05 vs. young group (n=6 young, n=5 aged).

References

    1. Rosamond W, Flegal K, Furie K, Go A, Greenlund K, Haase N, et al. Heart disease and stroke statistics--2008 update: A report from the american heart association statistics committee and stroke statistics subcommittee. Circulation. 2008;117:e25–146. - PubMed
    1. Knoflach M, Matosevic B, Rucker M, Furtner M, Mair A, Wille G, et al. Functional recovery after ischemic stroke--a matter of age: Data from the austrian stroke unit registry. Neurology. 2012;78:279–285. - PubMed
    1. Rojas JI, Zurru MC, Romano M, Patrucco L, Cristiano E. Acute ischemic stroke and transient ischemic attack in the very old--risk factor profile and stroke subtype between patients older than 80 years and patients aged less than 80 years. European journal of neurology: the official journal of the European Federation of Neurological Societies. 2007;14:895–899. - PubMed
    1. Yuan M, Siegel C, Zeng Z, Li J, Liu F, McCullough LD. Sex differences in the response to activation of the poly (adp-ribose) polymerase pathway after experimental stroke. Experimental neurology. 2009;217:210–218. - PMC - PubMed
    1. Liu F, Benashski SE, Persky R, Xu Y, Li J, McCullough LD. Age-related changes in amp-activated protein kinase after stroke. Age. 2012;34:157–168. - PMC - PubMed

Publication types