. 2014 May;25(5):1118-29.
doi: 10.1681/ASN.2013080859. Epub 2013 Dec 19.

Estimating podocyte number and density using a single histologic section

Affiliations

Estimating podocyte number and density using a single histologic section

Madhusudan Venkatareddy et al. J Am Soc Nephrol. 2014 May.

Abstract

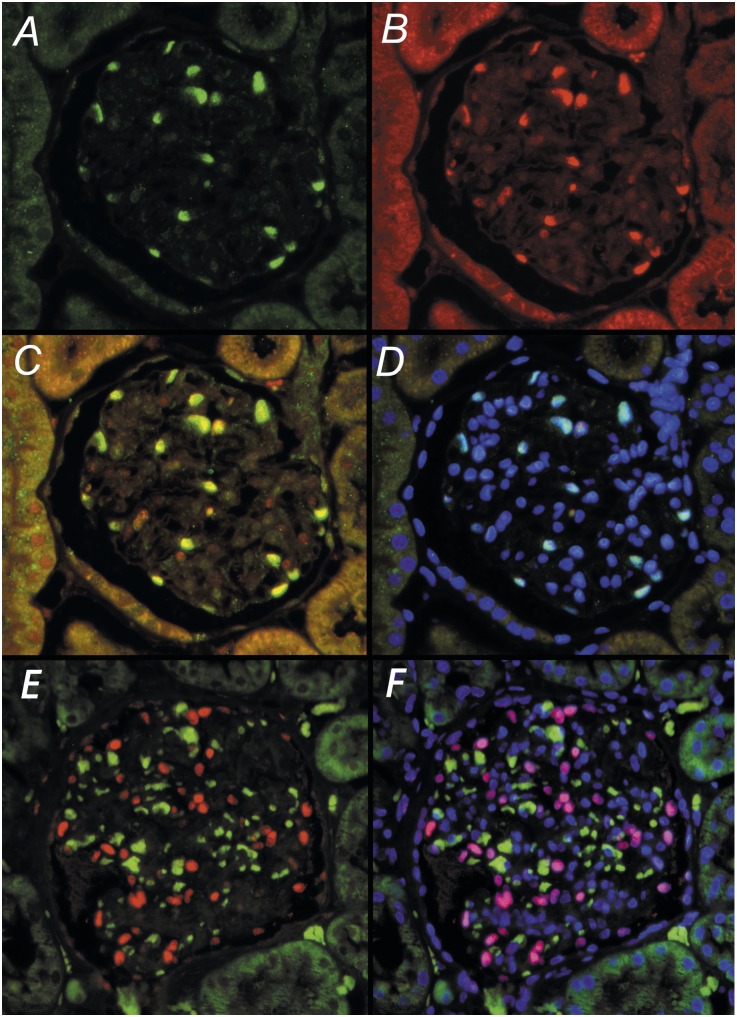
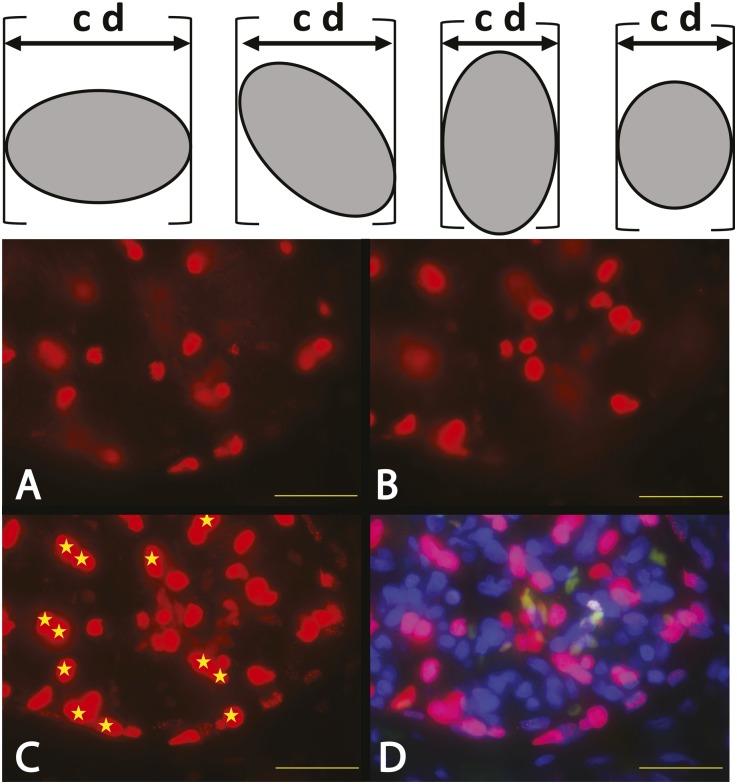
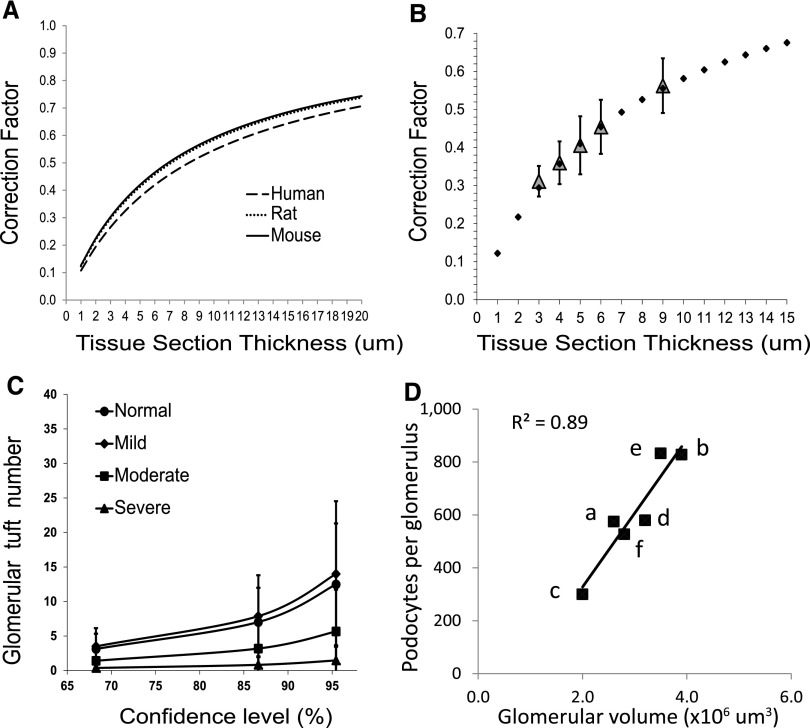
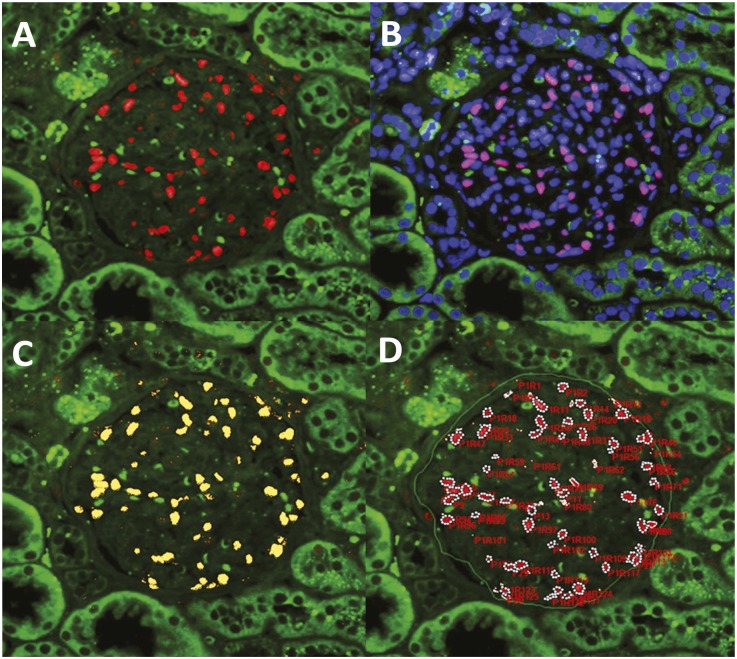
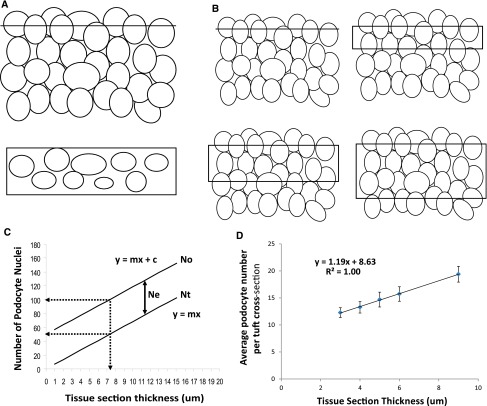
The reduction in podocyte density to levels below a threshold value drives glomerulosclerosis and progression to ESRD. However, technical demands prohibit high-throughput application of conventional morphometry for estimating podocyte density. We evaluated a method for estimating podocyte density using single paraffin-embedded formalin-fixed sections. Podocyte nuclei were imaged using indirect immunofluorescence detection of antibodies against Wilms' tumor-1 or transducin-like enhancer of split 4. To account for the large size of podocyte nuclei in relation to section thickness, we derived a correction factor given by the equation CF=1/(D/T+1), where T is the tissue section thickness and D is the mean caliper diameter of podocyte nuclei. Normal values for D were directly measured in thick tissue sections and in 3- to 5-μm sections using calibrated imaging software. D values were larger for human podocyte nuclei than for rat or mouse nuclei (P<0.01). In addition, D did not vary significantly between human kidney biopsies at the time of transplantation, 3-6 months after transplantation, or with podocyte depletion associated with transplant glomerulopathy. In rat models, D values also did not vary with podocyte depletion, but increased approximately 10% with old age and in postnephrectomy kidney hypertrophy. A spreadsheet with embedded formulas was created to facilitate individualized podocyte density estimation upon input of measured values. The correction factor method was validated by comparison with other methods, and provided data comparable with prior data for normal human kidney transplant donors. This method for estimating podocyte density is applicable to high-throughput laboratory and clinical use.


Figures

Figure 1.
Figure 1.
TLE4 antibody identifies podocyte nuclei as identified by WT1 antibodies in glomeruli of formalin-fixed kidney. (A–C) In a rat glomerulus, WT1 green fluorescence (A) and TLE4 red fluorescence (B) colocalize within podocyte nuclei (C). (D) Nuclear localization is confirmed by blue DAPI fluorescence to give a merged pale blue signal. (E) In formalin-fixed human glomeruli, TLE4 (red fluorescence) merged with the green nonspecific fluorescence signal provides a robust marker of podocyte nuclei (red) that can be excluded from nonspecific signals arising from autofluorescence blood products in glomerular capillaries (green/orange). (F) Confirmation that the red TLE4 signal is in nuclei is shown by colocalization with blue nuclear DAPI to give shocking pink human podocyte nuclei. Original magnification, ×100.
Figure 2.
Figure 2.
Podocyte nuclear mean caliper diameter D direct measurements. In the upper panel, the caliper diameter (cd) for a randomly orientated asymmetric object is the distance between the edges of the object in any single dimension as shown by the calipers (brackets). (A–D) The images show part of a human glomerulus in a 20-μm–thick section of human kidney developed using TLE-4 antibodies to identify podocyte nuclei by red fluorescence. A and B show the top and bottom optical sections respectively of a z-stacked composite image shown in C and D. C shows the z-stack composite in the red channel only. D shows the same z-stack composite using the merged red (TLE-4), green (nonspecific autofluorescence), and blue (DAPI) channels to identify podocyte nuclei (shocking pink) and exclude nonspecific autofluorescence of erythrocytes (orange/green). Podocyte nuclei that are sharply in focus in the top (A) or bottom (B) optical sections are excluded from further analysis, leaving only those podocyte nuclei that cannot have been partially sectioned (shown by yellow stars) to be evaluated. The podocyte nuclear caliper diameter (D) of the starred nuclei can thereby be directly measured by tracing their outer boarders using calibrated imaging software program to estimate the mean caliper diameter of 100 consecutive nuclei. Scale bar, 32 μm.
Figure 3.
Figure 3.
(A) CF variation in relation to section thickness for each species. The curves for human podocyte nuclei (mean caliper diameter 8.3 μm), rat podocyte nuclei (mean caliper diameter 7.1 μm), and mouse podocyte nuclei (mean caliper diameter 6.9 μm) are shown in relation to section thickness (x-axis) and the CF (y-axis) as calculated using the equation CF=1/(D/T+1). Note that the curves for rat and mouse are almost superimposable and that even the difference in nuclear size between human and rodent podocytes changes the CF by a relatively small amount (<10%). (B) Observed CF reflects predicted CF. CF values for sections of different thicknesses are estimated by comparing the observed number of podocyte nuclei in a section with the known number of podocyte nuclei per glomerulus measured using the two-thickness method and confirmed by serial sectioning through whole glomeruli to count all podocytes in five tissue blocks from different rat kidneys. The values for the CF at each section thickness±1 SD are plotted in relation to the section thickness (gray diamonds). A CF curve calculated using the equation CF=1/(D/T+1) using mean podocyte nuclear caliper diameter measured for rat podocyte nuclei of 7.1 μm is shown for a range of tissue section thickness (closed diamonds) demonstrating that the measured CF values corresponded to the CF values derived from the equation over a wide range of section thicknesses. (C) Glomerular tuft number required to reliably estimate podocyte density. The graph shows the confidence limits (x-axis) and tuft sample size required (y-axis) to obtain a value for podocyte number within 5% of the true value (derived from a sample size of 50 glomerular tufts). Data are from rats that have >90% of normal (n=15), mild (60%–89% of normal; n=10), moderate (30%–59% of normal; n=8), and severe (<30% of normal; n=9) podocyte depletion. Less than eight tuft profiles are required to arrive at a value within 5% of the measured value with 90% confidence for any level of podocyte depletion. (D) Published data for podocyte number per tuft and glomerular volume for donor kidneys varies 2- to 3-fold, as shown in Table 3. For kidney transplant donors, there are large differences in the estimated glomerular volume and podocyte number per tuft between different reports. However, when plotted against each other, there is a strong correlation between glomerular volume and podocyte number per glomerulus, indicating that the relationship between these two variables (podocyte density) does not vary much between different methods. The letters in D correspond to the following references: a, Pagtalunan et al. (1997); b, Steffes et al. (2001); c, Lemley et al. (2002); d, White et al. (2002); e, Dalla Vestra et al. (2003); and f, Venkatareddy et al. (current report).
Figure 4.
Figure 4.
Measurement of podocyte number and mean caliper diameter (d) using Image-Pro software. A glomerulus from a human kidney biopsy before implantation is shown processed for immunofluorescence imaging and photographed using the three-color system to identify podocyte nuclei (red TLE4) superimposed on blue DAPI (to give purple) as distinct from erythrocytes (green) (A). The red/green merged images are opened in the Image-Pro software (B), and a mask (yellow) is applied and adjusted to exactly cover red podocyte nuclei (C). Occasional TLE4-positive signals are present outside the glomerulus (e.g., at right of the glomerulus shown). An area of interest is drawn around the glomerular tuft (green line shown by arrows in D), and a number is automatically assigned to each masked structure. Overlapping nuclei are “split” using the software. All podocyte nuclei are then identified by clicking on them so that they become surrounded by white dots. Individual nuclear profile caliper diameters and the glomerular tuft area are automatically exported to an Excel file to give the podocyte nuclear number, mean podocyte nuclear caliper diameter (d), and glomerular tuft area. Original magnification, ×100.
Figure 5.
Figure 5.
Validation of the CF method using a multiple section thickness approach. (A) A hypothetical collection of randomly arranged solids cut by an infinitely thin plane is shown, which when viewed from above (A, bottom) contains ellipsoid solids randomly sectioned at various levels that can be counted to give a value (Ne). (B) The image shows how as this plane becomes thicker, it increasingly includes more solids counted as the observed (apparent) total number (No). No will be the sum of the number of solids cut by the infinitely thin plane at the edge of the section (Ne) plus the number of solids that increases in direct proportion to the thickness of the section (Ntrue or Nt). Nt therefore=No–Ne at any section thickness. (C) This relationship is shown diagrammatically, where the value for the observed number of solids (No) increases linearly with section thickness (described by the equation y=mx+c where y is the number of solids observed, x is the section thickness, m is the slope of this relationship, and c is the value for Ne. The true number of solids (Nt) is given by No–Ne at any section thickness. The dotted lines show that at a section thickness equal to mean caliper diameter of 7.1 μm, the observed podocyte number would be approximately twice the true podocyte number (or CF=0.5). (D) Real data are presented that are derived from counting the average number of podocyte nuclei in rat glomerular sections from a range of section thicknesses to derive parameters for the equation y=mx+c. Using these parameters, values can be calculated for No, Ne, Nt, and CF as shown in Table 2.

References

    1. Pagtalunan ME, Miller PL, Jumping-Eagle S, Nelson RG, Myers BD, Rennke HG, Coplon NS, Sun L, Meyer TW: Podocyte loss and progressive glomerular injury in type II diabetes. J Clin Invest 99: 342–348, 1997 - PMC - PubMed
    1. Kriz W, Gretz N, Lemley KV: Progression of glomerular diseases: Is the podocyte the culprit? Kidney Int 54: 687–697, 1998 - PubMed
    1. Kim YH, Goyal M, Kurnit D, Wharram B, Wiggins J, Holzman L, Kershaw D, Wiggins R: Podocyte depletion and glomerulosclerosis have a direct relationship in the PAN-treated rat. Kidney Int 60: 957–968, 2001 - PubMed
    1. Kriz W, LeHir M: Pathways to nephron loss starting from glomerular diseases-insights from animal models. Kidney Int 67: 404–419, 2005 - PubMed
    1. Wiggins JE, Goyal M, Sanden SK, Wharram BL, Shedden KA, Misek DE, Kuick RD, Wiggins RC: Podocyte hypertrophy, “adaptation,” and “decompensation” associated with glomerular enlargement and glomerulosclerosis in the aging rat: Prevention by calorie restriction. J Am Soc Nephrol 16: 2953–2966, 2005 - PubMed

Publication types

LinkOut - more resources