. 2013 Dec 19;4(12):e968.
doi: 10.1038/cddis.2013.502.

ERO1α-dependent endoplasmic reticulum-mitochondrial calcium flux contributes to ER stress and mitochondrial permeabilization by procaspase-activating compound-1 (PAC-1)

Affiliations

ERO1α-dependent endoplasmic reticulum-mitochondrial calcium flux contributes to ER stress and mitochondrial permeabilization by procaspase-activating compound-1 (PAC-1)

M Seervi et al. Cell Death Dis. .

Abstract

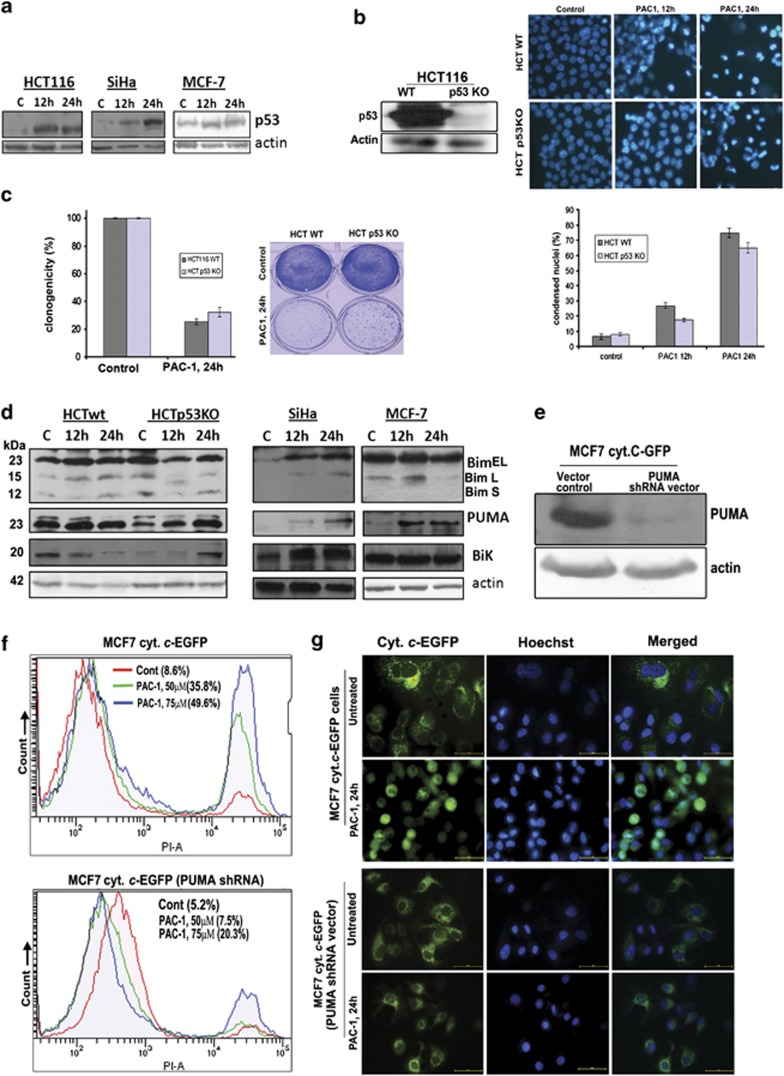
Procaspase-activating compound-1 (PAC-1) is the first direct caspase-activating compound discovered; using an in vitro cell-free system of caspase activation. Subsequently, this compound was shown to induce apoptosis in a variety of cancer cells with promising in vivo antitumor activity in canine lymphoma model. Recently, we have reported its ability to kill drug-resistant, Bcl-2/Bcl-xL overexpressing and Bax/Bak-deficient cells despite the essential requirement of mitochondrial cytochrome c (cyt. c) release for caspase activation, indicating that the key molecular targets of PAC-1 in cancer cells are yet to be identified. Here, we have identified Ero1α-dependent endoplasmic reticulum (ER) calcium leakage to mitochondria through mitochondria-associated ER membranes (MAM) and ER luminal hyper-oxidation as the critical events of PAC-1-mediated cell death. PAC-1 treatment upregulated Ero1α in multiple cell lines, whereas silencing of Ero1α significantly inhibited calcium release from ER and cell death. Loss of ER calcium and hyper-oxidation of ER lumen by Ero1α collectively triggered ER stress. Upregulation of GRP78 and splicing of X-box-binding protein 1 (XBP1) mRNA in multiple cancer cells suggested ER stress as the general event triggered by PAC-1. XBP1 mRNA splicing and GRP78 upregulation confirmed ER stress even in Bax/Bak double knockout and PAC-1-resistant Apaf-1-knockout cells, indicating an induction of ER stress-mediated mitochondrial apoptosis by PAC-1. Furthermore, we identified BH3-only protein p53 upregulated modulator of apoptosis (PUMA) as the key molecular link that orchestrates overwhelmed ER stress to mitochondria-mediated apoptosis, involving mitochondrial reactive oxygen species, in a p53-independent manner. Silencing of PUMA in cancer cells effectively reduced cyt. c release and cell death by PAC-1.


Figures

Figure 1
Figure 1
PAC-1 induces G1 arrest, cell death and autophagy irrespective of caspase-3 expression and without signs of DNA damage. (a) PAC-1 induced chromatin condensation in multiple cancer cell lines such as HCT116, SiHa, HeLa, SKOV3, ADR-RES, T47D, U2OS, T47D and caspase-3-deficient MCF7 cells. The percentages of condensed nuclei are represented graphically (n=3, mean±S.D.). (b) Western blot showing the expression of stably transfected procaspase-3 in MCF7 cells lacking caspase-3. (c) FACS analysis of apoptosis in MCF7 and MCF7C3 by annexin V staining after PAC-1 (75 μM, 24 h) treatment. (d) PAC-1 (75 μM, 12 h) arrested MCF7, MCF7C3, SiHa and HeLa cells in G1 phase of cell cycle before inducing apoptosis. (e) Immunofluorescence staining using H2AX antibody in HeLa cells showed that PAC-1 (100 μM, 24 h) did not induce any DNA damage. Cisplatin was used as positive control, which induced DNA damage, evident from the enhanced red fluorescence observed than untreated cells. (f) Immunofluorescence detection of LC3 suggested that PAC-1 induced massive autophagic granularization of LC3 in both MCF7 and MCF7C3 cells. (g) PAC-1-induced enhanced expression of LC3-II protein was detected by western blot in both MCF7 and MCF7C3 cells. β-Actin was used as loading control. (h) Addition of autophagy inhibitor 3-methyladenine (3-MA; 5 mM) along with PAC-1 could not inhibit cell death. Cell death was analyzed by PI staining using FACS and percentage of PI-positive cells are represented graphically for both MCF7 and MCF7C3 cells (n=3, mean±S.D.)
Figure 1
Figure 1
PAC-1 induces G1 arrest, cell death and autophagy irrespective of caspase-3 expression and without signs of DNA damage. (a) PAC-1 induced chromatin condensation in multiple cancer cell lines such as HCT116, SiHa, HeLa, SKOV3, ADR-RES, T47D, U2OS, T47D and caspase-3-deficient MCF7 cells. The percentages of condensed nuclei are represented graphically (n=3, mean±S.D.). (b) Western blot showing the expression of stably transfected procaspase-3 in MCF7 cells lacking caspase-3. (c) FACS analysis of apoptosis in MCF7 and MCF7C3 by annexin V staining after PAC-1 (75 μM, 24 h) treatment. (d) PAC-1 (75 μM, 12 h) arrested MCF7, MCF7C3, SiHa and HeLa cells in G1 phase of cell cycle before inducing apoptosis. (e) Immunofluorescence staining using H2AX antibody in HeLa cells showed that PAC-1 (100 μM, 24 h) did not induce any DNA damage. Cisplatin was used as positive control, which induced DNA damage, evident from the enhanced red fluorescence observed than untreated cells. (f) Immunofluorescence detection of LC3 suggested that PAC-1 induced massive autophagic granularization of LC3 in both MCF7 and MCF7C3 cells. (g) PAC-1-induced enhanced expression of LC3-II protein was detected by western blot in both MCF7 and MCF7C3 cells. β-Actin was used as loading control. (h) Addition of autophagy inhibitor 3-methyladenine (3-MA; 5 mM) along with PAC-1 could not inhibit cell death. Cell death was analyzed by PI staining using FACS and percentage of PI-positive cells are represented graphically for both MCF7 and MCF7C3 cells (n=3, mean±S.D.)
Figure 2
Figure 2
PAC-1 induces UPR and ER stress in multiple cell types including apoptotic defective cell lines. (a) Western blot demonstrates that PAC-1 did not alter the expression of proteins XIAP, Bak, Bak, Bcl-2, Hsp27, Hsp70 and Hsp90 significantly but it could induce significant upregulation of ER stress marker GRP78 and GRP94 proteins in both MCF7 and MCF7C3 cells. β-Actin was used as loading control. (b) PAC-1 induced expression of several UPR indicator proteins such as CHOP, IRE1α, Ero1α and p-eIF2α both in MCF7 and MCF7C3 cells. β-Actin was used as loading control. (c) PAC-1 treatment upregulated ER stress marker protein GRP78 in multiple cancer cell lines such as MCF7, HCT116, U2OS, SKOV3, SiHa and HeLa. β-Actin was used as loading control. (d) Splicing of XBP1 mRNA was observed by RT-PCR in multiple cancer cells such as MCF7, HCT116, SiHa and Hela after PAC-1 treatment. Thapsigargin was used as positive control. (e) Cell death was analyzed by annexin V binding and PI staining in MEF WT and Bax/Bak DKO cells using FACS. The percentages of PI and annexin-positive cells are mentioned in Q2 quadrant representing apoptotic cells. Western blot and RT-PCR results suggest that PAC-1 induced upregulation of GRP78 as well as splicing of XBP1 mRNA in both MEF WT and DKO cells. β-Actin was used as loading control. (f) Cell death was analyzed by PI staining in MEF WT and MEF Apaf-1 KO cells using FACS after PAC-1 (50 μM) treatment. There was negligible cell death in Apaf-1 KO cells than its WT counterpart. The percentage of PI-positive cells is represented in P2 gate. Furthermore, western blot and RT-PCR results suggest that PAC-1 induced splicing of XBP1 mRNA and upregulation of GRP78 efficiently in WT as well as Apaf-1 KO cells even though cell death was absent in Apaf-1 KO cells
Figure 3
Figure 3
GRP78-silencing enhances, whereas translational inhibitor cycloheximide reduces cell death mediated by PAC-1. (a and b) MCF7 and HeLa cells were transfected with siGRP78. Silencing of GRP78 was confirmed in blot. Cell death was analyzed by PI staining using FACS after silencing GRP78. The comparison and percentage of PI-positive cells are represented graphically (n=3, mean±S.D.). (c) ER stress was inhibited by using cycloheximide (CHX; 2 μg/ml) along with PAC-1, and caspase activity was evaluated using FACS by employing caspase-3 and -7 specific FRET probe, CFP-DEVD-YFP, stably transfected in HeLa and MCF7 cells. Cleavage of DEVD sequence by activated caspases will cause FRET loss which is reflected as enhancement of CFP/YFP ratio. As shown in the gates (FRET lost-population), cycloheximide reduced percentage of cells with FRET loss, suggesting that ER stress inhibition reduces caspase activation induced by PAC-1. (d) Cell death was analyzed by PI staining using FACS in MCF7 and HCT116 after PAC-1 treatment in the presence and absence of cycloheximide. The percentage of PI-positive cells is indicated in respective histograms, suggesting that cycloheximide inhibited cell death induced by PAC-1. (e) Cell survival was analyzed by clonogenicity assay in PAC-1-treated MCF7 and HCT116 cells, with and without cycloheximide. As noted in images, translational inhibitor cycloheximide rescued cells from PAC-1-induced cell death when used along with PAC-1. Absorbance was measured for the solubilized stain and relative percentage of clonogenicity is represented in graph (n=3, mean±S.D.)
Figure 4
Figure 4
p53-independent PUMA upregulation by PAC-1 promotes mitochondria-mediated apoptosis. (a) Western blot analysis indicated that p53 was upregulated in multiple cancer cells upon PAC-1 treatment. (b) PAC-1 induced significant nuclear condensation in HCT116 and p53 KO HCT116 cells as seen in representative microscopic images and graph (n=3, mean±S.D.). Western blot established the knockout status of p53 in HCT116. (c) Clonogenic cell survival assay revealed that PAC-1 effectively killed HCT116 p53 KO cells, although slightly lesser than its WT counterpart. Representative images and graph are given (n=3, mean ±S.D.). (d) PAC-1 induced upregulation of PUMA in multiple cancer cell lines. As seen in blot, PUMA is upregulated even in the absence of p53 (HCT116 p53 KO). Bim and Bik were also upregulated in SiHa cells but not in MCF7 and HCT116 cells, suggesting cell specificity of the response. (e) A representative western blot indicating silencing of PUMA in MCF7 cyt. c-EGFP cells. (f) Cell death was analyzed by PI staining using FACS in MCF7 cyt. c-EGFP cells as well as PUMA-silenced MCF7 cyt. c-EGFP cells. As noticed, silencing of PUMA inhibited PAC-1-induced cell death significantly. The percentages of PI-positive cells are mentioned. (g) Silencing of PUMA inhibited cyt. c release from the mitochondria and nuclear condensation in MCF7 cyt. c-EGFP cells upon PAC-1 treatment. The representative fluorescent microscopic images are shown (scale bar: 50 μm). The diffuse pattern of EGFP in cells represents release of cyt. c from the mitochondria
Figure 5
Figure 5
Ero1α mediates calcium flux from ER to the mitochondria through engagement of MAM. (a) HeLa cells stably expressing ER-targeted ratiometric FRET probe (D1ER chameleon) was used to monitor release of ER calcium. CFP/YFP ratio was measured from images and represented graphically (n=3). The ratio images of cells before PAC-1 treatment and 2 h after PAC-1 treatment are shown along with ratio scale. (b) HeLa D1ER cells were transfected with either scrambled siRNA or siRNA against human Ero1α or CHOP as described. The cells were treated with PAC-1 for 24 h and whole-cell extract was used for western blot using Ero1α or CHOP antibody. β-Actin served as loading control. (c) HeLa D1ER cells 24 h after transfections with siEro1α or siCHOP were treated with PAC-1 and imaged for calcium release as described. The average CFP/YFP ratio was measured from images and represented graphically (n=3). (d) Cells transfected with siSC (scrambled) or siEro1α or siCHOP were treated with PAC-1 for 24 h. Cell death was quantified after staining the cells using Hoechst to visualize chromatin condensation. (e) HeLa, U2OS, SW480, p53 knockout HCT116 cells and MEF Bax/Bak DKO cells were treated with PAC-1 for indicated time periods. The whole-cell extract was prepared and used for western blotting using antibody against Ero1α. Induction of Bim exhibited by MEF Bax/Bak DKO cells is also shown. β-Actin served as loading control. (f) HeLa cells expressing EGFP targeted at ER and DsRed targeted at mitochondria were treated with PAC-1 for 12 h. Representative confocal images of mitochondria and ER of treated and untreated cells are shown
Figure 6
Figure 6
ER hyper-oxidation, mitochondrial calcium uptake and mitochondrial ROS generation contributes to cell death by PAC-1. (a) HeLa and MEF DKO cells were treated with 50 or 100 μM of PAC-1 for 24 h. The cells were stained with mitochondrial calcium indicator Rhod-2 as described. Rhod-2 fluorescence analyzed by FACS is shown as histograms. (b) HeLa and MEF DKO cells were either pretreated with 0.05% DMSO or mitochondrial calcium uptake inhibitor, Ru360 (25 μM) or cell-permeant calcium chelator, BAPTA-AM (50 μM) followed by PAC-1 treatment for 24 h. Cell death was quantified by chromatin condensation assay as described (n=3, mean±S.D.). (c) HeLa cells stably expressing mitochondria-targeted roGFP were developed as described. Microscopic image of mitochondrial localization of the probe is shown at × 100 magnification. The emission at 535/30 nm was collected at dual excitation 405/20X and 490/20X in sequential mode using × 60 objective for both untreated and treated (PAC-1 for 12 h) stable cells. The ratio images were generated by dividing 405 nm channel by 490 nm channel on a pixel by pixel basis. The ratio scale is also shown. (d) HeLa cells stably expressing ER-targeted roGFP, roGFP2-iL-KDEL was developed as described. Microscopic image of ER-targeted probe is shown at × 100 magnification. Ratio imaging was carried out as earlier using × 100 objectives. The ratio images were generated by dividing 405 nm channel by 490 nm channel on a pixel by pixel basis. The ratio scale is also shown

Similar articles

Cited by

References

    1. Earnshaw WC, Martins LM, Kaufmann SH. Mammalian caspases: structure, activation, substrates, and functions during apoptosis. Ann Rev Biochem. 1999;68:383–424. - PubMed
    1. Cohen GM. Caspases: the executioners of apoptosis. Biochem J. 1997;326 (Pt 1:1. - PMC - PubMed
    1. Yip KW, Reed JC. Bcl-2 family proteins and cancer. Oncogene. 2008;27:6398–6406. - PubMed
    1. Thompson CB. Apoptosis in the pathogenesis and treatment of disease. Science. 1995;267:1456–1462. - PubMed
    1. Kuwana T, Newmeyer DD. Bcl-2-family proteins and the role of mitochondria in apoptosis. Curr Opin Cell Biol. 2003;15:691–699. - PubMed

Publication types

MeSH terms