

Antibodies to heteromeric glycolipid complexes in Guillain-Barré syndrome
- PMID: 24358172
- PMCID: PMC3864991
- DOI: 10.1371/journal.pone.0082337
Antibodies to heteromeric glycolipid complexes in Guillain-Barré syndrome
Abstract
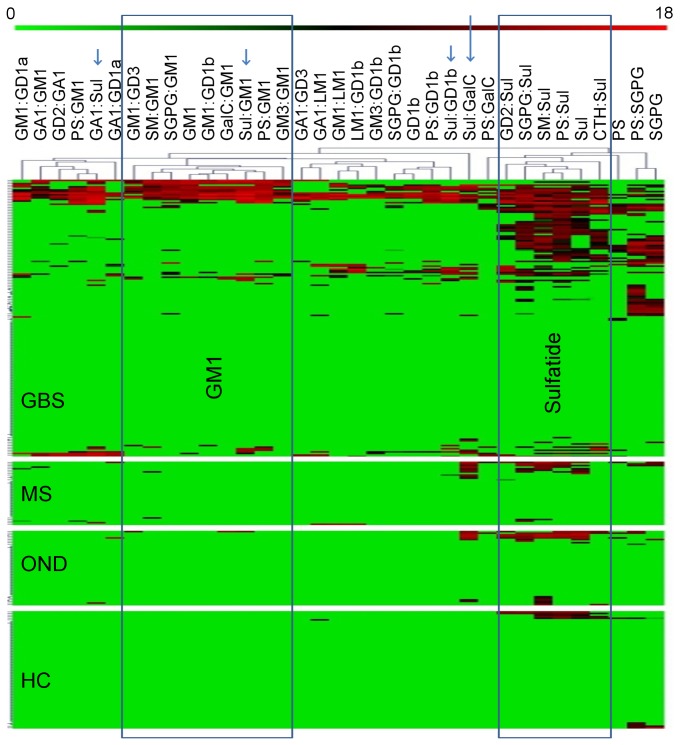
Autoantibodies are infrequently detected in the sera of patients with the demyelinating form of Guillain-Barré syndrome most commonly encountered in the Western world, despite abundant circumstantial evidence suggesting their existence. We hypothesised that antibody specificities reliant on the cis interactions of neighbouring membrane glycolipids could explain this discrepancy, and would not have been detected by traditional serological assays using highly purified preparations of single gangliosides. To assess the frequency of glycolipid complex antibodies in a Western European cohort of patients GBS we used a newly developed combinatorial glycoarray methodology to screen against large range of antigens (11 gangliosides, 8 other single glycolipids and 162 heterodimeric glycolipid complexes). Serum samples of 181 patients from a geographically defined, Western European cohort of GBS cases were analysed, along with 161 control sera. Serum IgG binding to single gangliosides was observed in 80.0% of axonal GBS cases, but in only 11.8% of cases with demyelinating electrophysiology. The inclusion of glycolipid complexes increased the positivity rate in demyelinating disease to 62.4%. There were 40 antigens with statistically significantly increased binding intensities in GBS as compared to healthy control sera. Of these, 7 complex antigens and 1 single ganglioside also produced statistically significantly increased binding intensities in GBS versus neurological disease controls. The detection of antibodies against specific complexes was associated with particular clinical features including disease severity, requirement for mechanical ventilation, and axonal electrophysiology. This study demonstrates that while antibodies against single gangliosides are often found in cases with axonal-type electrophysiology, antibodies against glycolipid complexes predominate in cases with demyelinating electrophysiology, providing a more robust serum biomarker than has ever been previously available for such cases. This work confirms the activation of the humoral immune system in the dysimmune disease process in GBS, and correlates patterns of antigen recognition with different clinical features.
Conflict of interest statement
Figures


Similar articles
-
Serological study using glycoarray for detecting antibodies to glycolipids and glycolipid complexes in immune-mediated neuropathies.J Neuroimmunol. 2016 Dec 15;301:35-40. doi: 10.1016/j.jneuroim.2016.10.010. Epub 2016 Nov 2. J Neuroimmunol. 2016. PMID: 27836184
-
Antibodies to single glycolipids and glycolipid complexes in Guillain-Barré syndrome subtypes.Neurology. 2014 Jul 8;83(2):118-24. doi: 10.1212/WNL.0000000000000577. Epub 2014 Jun 11. Neurology. 2014. PMID: 24920848 Free PMC article.
-
Ambiguous value of anti-ganglioside IgM autoantibodies in Guillain-Barré syndrome and its variants.J Neurol. 2015 Aug;262(8):1954-60. doi: 10.1007/s00415-015-7806-4. Epub 2015 Jun 9. J Neurol. 2015. PMID: 26050638
-
Antiganglioside, antiganglioside-complex, and antiglycolipid-complex antibodies in immune-mediated neuropathies.Curr Opin Neurol. 2016 Oct;29(5):572-80. doi: 10.1097/WCO.0000000000000361. Curr Opin Neurol. 2016. PMID: 27427992 Review.
-
[Immune-mediated neuropathy].Rinsho Shinkeigaku. 2008 Nov;48(11):1023-5. doi: 10.5692/clinicalneurol.48.1023. Rinsho Shinkeigaku. 2008. PMID: 19198151 Review. Japanese.
Cited by
-
Bickerstaff brainstem encephalitis with or without anti-GQ1b antibody.Neurol Neuroimmunol Neuroinflamm. 2020 Sep 15;7(6):e889. doi: 10.1212/NXI.0000000000000889. Print 2020 Nov. Neurol Neuroimmunol Neuroinflamm. 2020. PMID: 32934014 Free PMC article.
-
Guillain-Barré syndrome: History, pathogenesis, treatment, and future directions.Eur J Neurol. 2024 Nov;31(11):e16346. doi: 10.1111/ene.16346. Epub 2024 May 16. Eur J Neurol. 2024. PMID: 38752584 Free PMC article. Review.
-
Guillain-Barré syndrome: expanding the concept of molecular mimicry.Trends Immunol. 2022 Apr;43(4):296-308. doi: 10.1016/j.it.2022.02.003. Epub 2022 Mar 4. Trends Immunol. 2022. PMID: 35256276 Free PMC article. Review.
-
Varied antibody reactivities and clinical relevance in anti-GQ1b antibody-related diseases.Neurol Neuroimmunol Neuroinflamm. 2018 Sep 11;5(6):e501. doi: 10.1212/NXI.0000000000000501. eCollection 2018 Nov. Neurol Neuroimmunol Neuroinflamm. 2018. PMID: 30246056 Free PMC article.
-
Guillain-Barré Syndrome Outbreak in Peru 2019 Associated With Campylobacter jejuni Infection.Neurol Neuroimmunol Neuroinflamm. 2021 Feb 5;8(2):e952. doi: 10.1212/NXI.0000000000000952. Print 2021 Mar. Neurol Neuroimmunol Neuroinflamm. 2021. PMID: 33547152 Free PMC article.
References
-
- Goodyear CS, O’Hanlon GM, Plomp JJ, Wagner ER, Morrison I et al. (1999) Monoclonal antibodies raised against Guillain-Barre syndrome-associated Campylobacter jejuni lipopolysaccharides react with neuronal gangliosides and paralyze muscle-nerve preparations. J_Clin_Invest 104: 697–708. - PMC - PubMed
-
- Halstead SK, O’Hanlon GM, Humphreys PD, Morrison DB, Morgan BP et al. (2004) Anti-disialoside antibodies kill perisynaptic Schwann cells and damage motor nerve terminals via membrane attack complex in a murine model of neuropathy. Brain 127: 2109–2123. doi:10.1093/brain/awh231. PubMed: 15289269. - DOI - PubMed
Publication types
MeSH terms
Substances
Grants and funding
LinkOut - more resources
Full Text Sources
Other Literature Sources
Medical
