Expression profile of CYP1A1 and CYP1B1 enzymes in colon and bladder tumors
- PMID: 24358191
- PMCID: PMC3864999
- DOI: 10.1371/journal.pone.0082487
Expression profile of CYP1A1 and CYP1B1 enzymes in colon and bladder tumors
Abstract
Background: The cytochrome P450 CYP1A1 and CYP1B1 enzymes are involved in carcinogenesis via activation of pro-carcinogenic compounds to carcinogenic metabolites. CYP1A1 and CYP1B1 have shown elevated levels in human tumors as determined by qRT-PCR and immunohistochemical studies. However studies that have examined CYP1 expression by enzyme activity assays are limited.
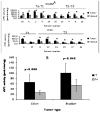
Results: In the current study the expression of CYP1A1 and CYP1B1 was investigated in a panel of human tumors of bladder and colorectal origin by qRT-PCR and enzyme activity assays. The results demonstrated that 35% (7/20) of bladder tumors and 35% (7/20) of colon tumors overexpressed active CYP1 enzymes. CYP1B1 mRNA was overexpressed in 65% and 60% of bladder and colon tumors respectively, whereas CYP1A1 was overexpressed in 65% and 80% of bladder and colon tumors. Mean mRNA levels of CYP1B1 and CYP1A1 along with mean CYP1 activity were higher in bladder and colon tumors compared to normal tissues (p<0.05). Statistical analysis revealed CYP1 expression levels to be independent of TNM status. Moreover, incubation of tumor microsomal protein in 4 bladder and 3 colon samples with a CYP1B1 specific antibody revealed a large reduction (72.5 ± 5.5 % for bladder and 71.8 ± 7.2% for colon) in catalytic activity, indicating that the activity was mainly attributed to CYP1B1 expression.
Conclusions: The study reveals active CYP1 overexpression in human tumors and uncovers the potential use of CYP1 enzymes and mainly CYP1B1 as targets for cancer therapy.
Conflict of interest statement
Figures


Similar articles
-
Expression profile of CYP1A1 and CYP1B1 enzymes in endometrial tumors.Tumour Biol. 2014 Oct;35(10):9549-56. doi: 10.1007/s13277-014-2240-2. Epub 2014 Jun 24. Tumour Biol. 2014. PMID: 24957043
-
Induction of CYP1A1, CYP1A2, and CYP1B1 mRNAs by nitropolycyclic aromatic hydrocarbons in various human tissue-derived cells: chemical-, cytochrome P450 isoform-, and cell-specific differences.Arch Toxicol. 2002 Jun;76(5-6):287-98. doi: 10.1007/s00204-002-0340-z. Epub 2002 Apr 10. Arch Toxicol. 2002. PMID: 12107646
-
Inhibition of procarcinogen-bioactivating human CYP1A1, CYP1A2 and CYP1B1 enzymes by melatonin.J Pineal Res. 2010 Jan;48(1):55-64. doi: 10.1111/j.1600-079X.2009.00724.x. Epub 2009 Nov 16. J Pineal Res. 2010. PMID: 19919601
-
Cytochrome P450 1 family and cancers.J Steroid Biochem Mol Biol. 2015 Mar;147:24-30. doi: 10.1016/j.jsbmb.2014.11.003. Epub 2014 Nov 6. J Steroid Biochem Mol Biol. 2015. PMID: 25448748 Review.
-
The Activation of Procarcinogens by CYP1A1/1B1 and Related Chemo-Preventive Agents: A Review.Curr Cancer Drug Targets. 2021;21(1):21-54. doi: 10.2174/1568009620666201006143419. Curr Cancer Drug Targets. 2021. PMID: 33023449 Review.
Cited by
-
Aberrant DNA Methylation: Implications in Racial Health Disparity.PLoS One. 2016 Apr 25;11(4):e0153125. doi: 10.1371/journal.pone.0153125. eCollection 2016. PLoS One. 2016. PMID: 27111221 Free PMC article.
-
Breast Tumor Kinase (Brk/PTK6) Mediates Advanced Cancer Phenotypes via SH2-Domain Dependent Activation of RhoA and Aryl Hydrocarbon Receptor (AhR) Signaling.Mol Cancer Res. 2021 Feb;19(2):329-345. doi: 10.1158/1541-7786.MCR-20-0295. Epub 2020 Nov 10. Mol Cancer Res. 2021. PMID: 33172975 Free PMC article.
-
Role of the Aryl Hydrocarbon Receptor in Colon Neoplasia.Cancers (Basel). 2015 Jul 31;7(3):1436-46. doi: 10.3390/cancers7030847. Cancers (Basel). 2015. PMID: 26264025 Free PMC article.
-
Diosmetin Attenuates Akt Signaling Pathway by Modulating Nuclear Factor Kappa-Light-Chain-Enhancer of Activated B Cells (NF-κB)/Inducible Nitric Oxide Synthase (iNOS) in Streptozotocin (STZ)-Induced Diabetic Nephropathy Mice.Med Sci Monit. 2018 Oct 2;24:7007-7014. doi: 10.12659/MSM.910764. Med Sci Monit. 2018. PMID: 30278036 Free PMC article.
-
Isorhamnetin Modulates Drug-Resistance-Related Biomarkers in Colon Cancer Cells.Int J Mol Sci. 2025 Jun 27;26(13):6208. doi: 10.3390/ijms26136208. Int J Mol Sci. 2025. PMID: 40649986 Free PMC article.
References
-
- Sternberg CN, Donat SM, Bellmunt J, Millikan RE, Stadler W et al. (2007) Chemotherapy for bladder cancer: treatment guidelines for neoadjuvant chemotherapy, bladder preservation, adjuvant chemotherapy, and metastatic cancer. Urology 69(Suppl 1): 62-79. doi:10.1016/j.urology.2006.11.018. PubMed: 17280909. - DOI - PubMed
Publication types
MeSH terms
Substances
LinkOut - more resources
Full Text Sources
Other Literature Sources
Medical

