

Unique T cells with unconventional cytokine profiles induced in the livers of mice during Schistosoma mansoni infection
- PMID: 24358216
- PMCID: PMC3865148
- DOI: 10.1371/journal.pone.0082698
Unique T cells with unconventional cytokine profiles induced in the livers of mice during Schistosoma mansoni infection
Abstract
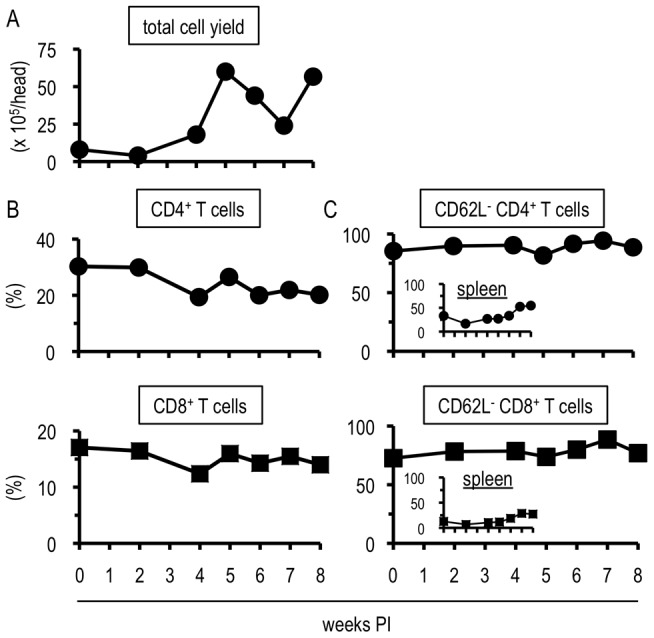
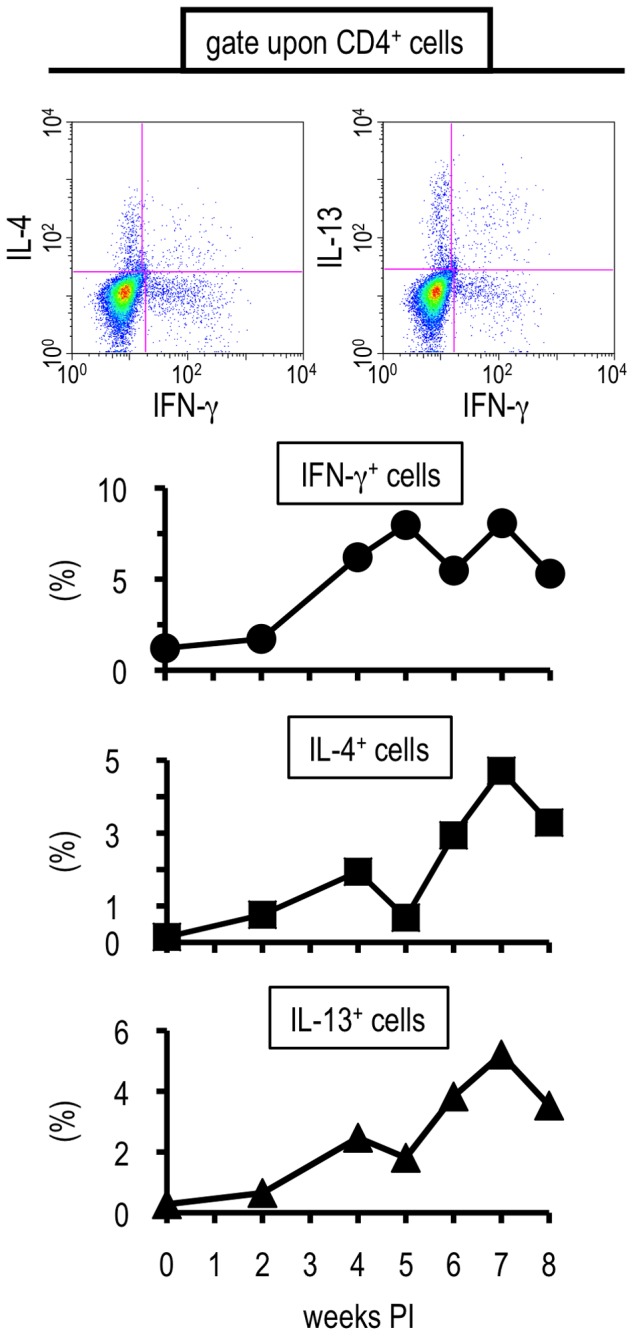
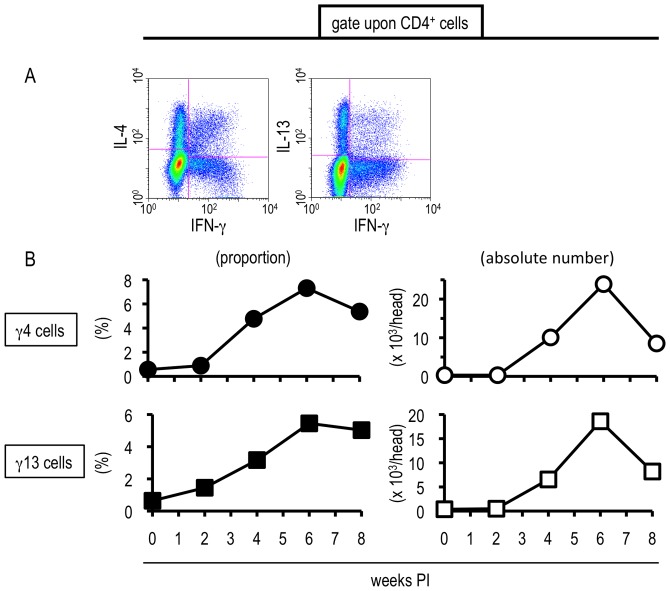
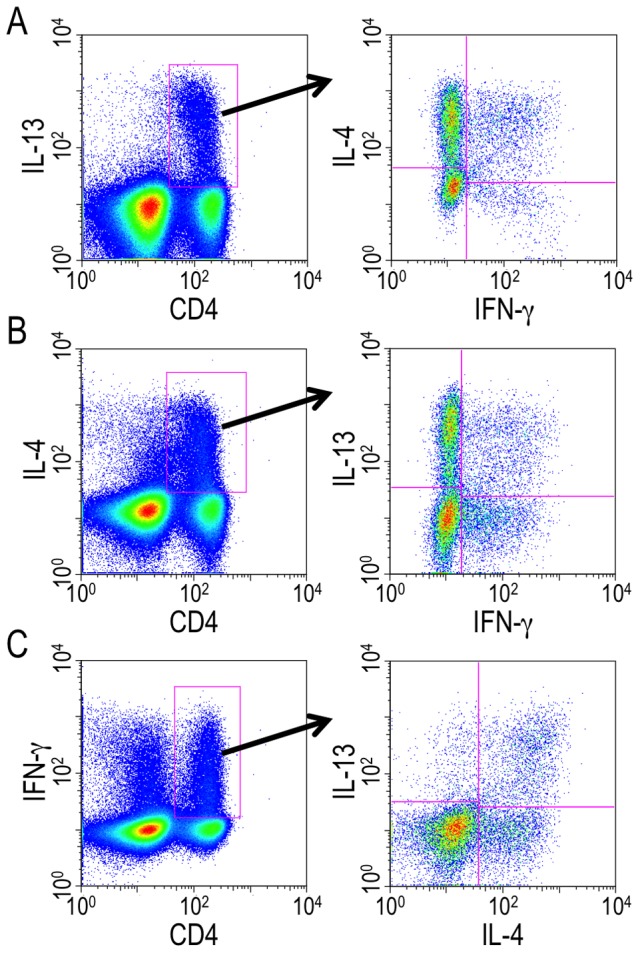
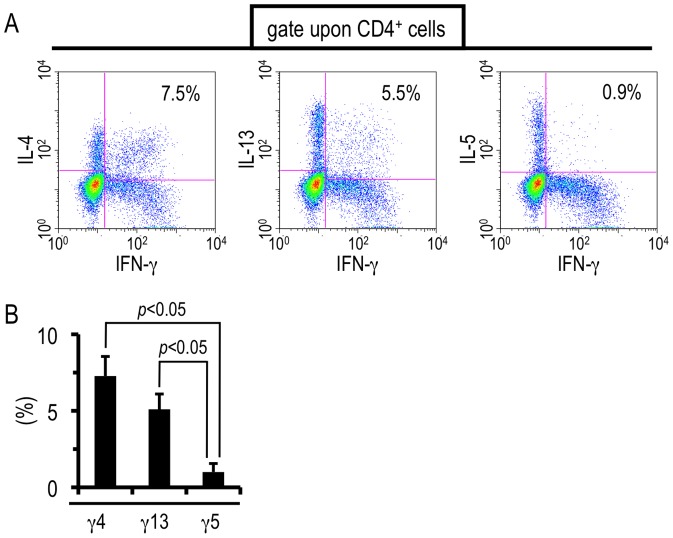
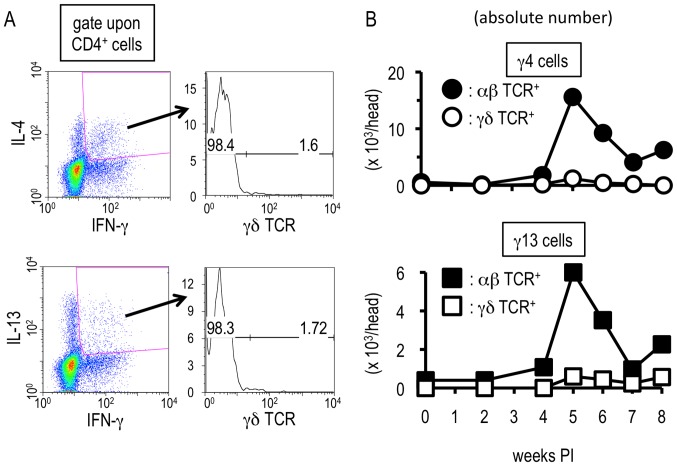
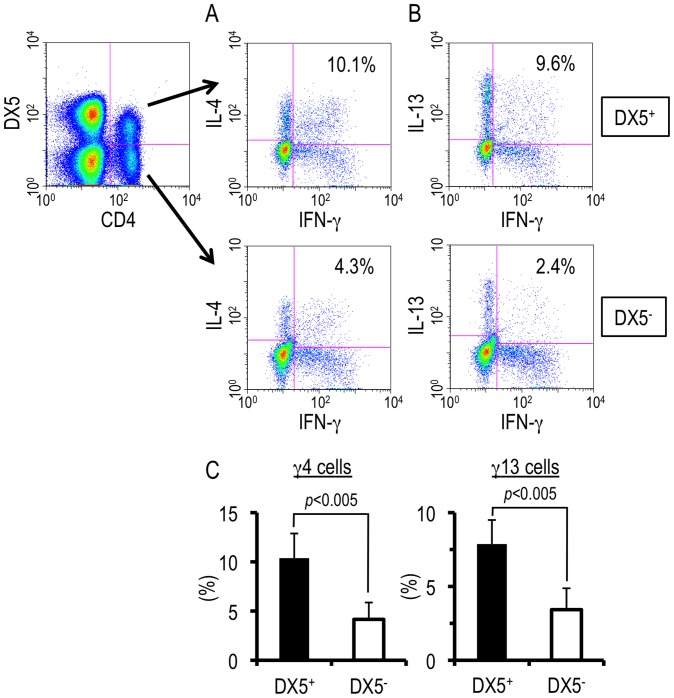
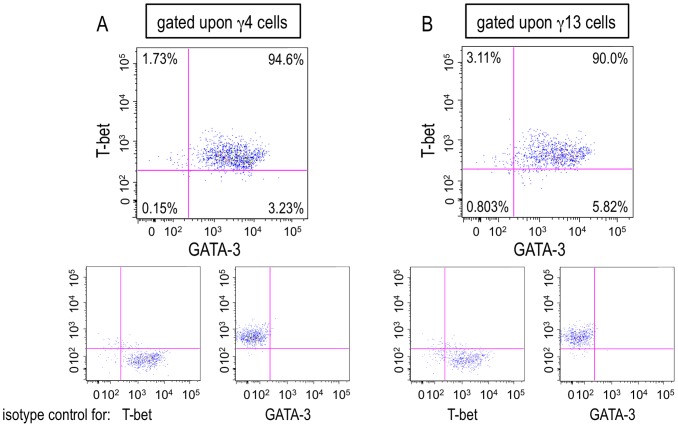
During infection with Schistosoma, serious hepatic disorders are induced in the host. The liver possesses unique immune systems composed of specialized cells that differ from those of other immune competent organs or tissues. Host immune responses change dramatically during Schistosoma mansoni infection; in the early phase, Th1-related responses are induced, whereas during the late phase Th2 reactions dominate. Here, we describe unique T cell populations induced in the liver of mice during the period between Th1- and Th2-phases, which we term the transition phase. During this phase, varieties of immune cells including T lymphocytes increase in the liver. Subsets of CD4(+) T cells exhibit unique cytokine production profiles, simultaneously producing both IFN-γ and IL-13 or both IFN-γ and IL-4. Furthermore, cells triply positive for IFN-γ, IL-13 and IL-4 also expand in the S. mansoni-infected liver. The induction of these unique cell populations does not occur in the spleen, indicating it is a phenomenon specific to the liver. In single hepatic CD4(+) T cells showing the unique cytokine profiles, both T-bet and GATA-3 are expressed. Thus, our studies show that S. mansoni infection triggers the induction of hepatic T cell subsets with unique cytokine profiles.
Conflict of interest statement
Figures
Similar articles
-
Involvement of IL-18 in the expansion of unique hepatic T cells with unconventional cytokine profiles during Schistosoma mansoni infection.PLoS One. 2014 May 13;9(5):e96042. doi: 10.1371/journal.pone.0096042. eCollection 2014. PLoS One. 2014. PMID: 24824897 Free PMC article.
-
Strongyloides venezuelensis-infection alters the profile of cytokines and liver inflammation in mice co-infected with Schistosoma mansoni.Cytokine. 2020 Mar;127:154931. doi: 10.1016/j.cyto.2019.154931. Epub 2019 Nov 26. Cytokine. 2020. PMID: 31783260
-
Defined Intestinal Regions Are Drained by Specific Lymph Nodes That Mount Distinct Th1 and Th2 Responses Against Schistosoma mansoni Eggs.Front Immunol. 2020 Oct 23;11:592325. doi: 10.3389/fimmu.2020.592325. eCollection 2020. Front Immunol. 2020. PMID: 33193437 Free PMC article.
-
T Lymphocyte-Mediated Liver Immunopathology of Schistosomiasis.Front Immunol. 2020 Feb 18;11:61. doi: 10.3389/fimmu.2020.00061. eCollection 2020. Front Immunol. 2020. PMID: 32132991 Free PMC article. Review.
-
Schistosoma mansoni infection induces a type 1 CD8+ cell response.Behring Inst Mitt. 1997 Mar;(99):79-84. Behring Inst Mitt. 1997. PMID: 9303205 Review.
Cited by
-
Involvement of IL-18 in the expansion of unique hepatic T cells with unconventional cytokine profiles during Schistosoma mansoni infection.PLoS One. 2014 May 13;9(5):e96042. doi: 10.1371/journal.pone.0096042. eCollection 2014. PLoS One. 2014. PMID: 24824897 Free PMC article.
-
Advances in the Diagnosis of Human Schistosomiasis.Clin Microbiol Rev. 2015 Oct;28(4):939-67. doi: 10.1128/CMR.00137-14. Clin Microbiol Rev. 2015. PMID: 26224883 Free PMC article. Review.
-
Parasites alter the pathological phenotype of lupus nephritis.Autoimmunity. 2014 Dec;47(8):538-47. doi: 10.3109/08916934.2014.929669. Epub 2014 Jun 24. Autoimmunity. 2014. PMID: 24957876 Free PMC article.
-
Schistosoma mansoni infection suppresses the growth of Plasmodium yoelii parasites in the liver and reduces gametocyte infectivity to mosquitoes.PLoS Negl Trop Dis. 2018 Jan 26;12(1):e0006197. doi: 10.1371/journal.pntd.0006197. eCollection 2018 Jan. PLoS Negl Trop Dis. 2018. PMID: 29373600 Free PMC article.
References
-
- Tsutsui H, Matsui K, Okamura H, Nakanishi K (2000) Pathophysiological roles of interleukin-18 in inflammatory liver diseases. Immunol Rev 174: 192–209. - PubMed
-
- Crispe IN (2003) Hepatic T cells and liver tolerance. Nat Rev Immunol 3: 51–62. - PubMed
-
- Thomson AW, Knolle PA (2010) Antigen-presenting cell function in the tolerogenic liver environment. Nat Rev Immunol 10: 753–766. - PubMed
-
- Abo T, Kawamura T, Watanabe H (2000) Physiological responses of extrathymic T cells in the liver. Immunol Rev 174: 135–149. - PubMed
-
- Crispe IN (2009) The liver as a lymphoid organ. Annu Rev Immunol 27: 147–163. - PubMed
Publication types
MeSH terms
Substances
LinkOut - more resources
Full Text Sources
Other Literature Sources
Research Materials
