. 2013 Dec 17;8(12):e83589.
doi: 10.1371/journal.pone.0083589. eCollection 2013.

Creating rat model for hypoxic brain damage in neonates by oxygen deprivation

Affiliations

Creating rat model for hypoxic brain damage in neonates by oxygen deprivation

Qiaoli Zhang et al. PLoS One. .

Abstract

Current study explores the feasibility of using a non-surgical method of oxygen deprivation to create Hypoxic brain damage in neonatal rats for medical studies. 7-day-old Sprague Dowley (SD) rats were kept in a container with low oxygen level (8%) for 1.5h. A second group had bilateral cephalic artery ligation before the 1.5h-low oxygen treatment, a method similar to the popular Rice method, to expose the brain to both hypoxic and ischemic situations. Short term neural functions and brain water weights were evaluated 1 day after the hypoxic treatment. Brain pathology and histology were also examined at 1 day and 3 days after the hypoxic treatment. Both groups showed impaired neural functions and increased brain water weight compared to the controls. Histology studies also revealed injuries in the subcortex, hippocampus and lateral ventricle in the brains from both groups. There is no significant difference in the degree of brain damages observed in the two groups. Our work demonstrated that oxygen deprivation alone is sufficient to cause brain damages similar to those seen in Hypoxic-ischemic brain disease (HIBD). Because this method avoids the invasive surgical procedure and therefore reduces the stress and mortality of laboratory animals during the experiment, we recommend it to be the favorable method for creating rat models for HIBD studies.


Conflict of interest statement

Competing Interests: The authors have declared that no competing interests exist.

Figures

Figure 1
Figure 1. HE staining result of subcortex brain injury tissue (400×) in each group.
A Normal control group has normal structure, regular cell arrangement and complete cell outline with intact, center-positioned nucleus and clear entoblast; B, hypoxic 1d; C, hypoxic 3d; D, ischemia+hypoxic 1d; E, ischemia+hypoxic 3d. In the hypoxic group (B to E), we observed leukoaraiosis, abnormal cell arrangement and partial or complete neuron degeneration, at 3d after the experiment, there is apparent recovery in the tissue damages in both the hypoxic group and the ischemic+hypoxic group compared to those observed in 1d. No obviously difference observed in 2 hypoxic treated group.
Figure 2
Figure 2. Hippocampus brain injury HE staining result (400×).
A, control group; B, hypoxic 1d; C, hypoxic 3d; D, ischemia+hypoxic 1d; E, ischemia+hypoxic 3d.
Figure 3
Figure 3. HE staining result of brain injury around lateral ventricle (400×).
A, control group; B, hypoxic 1d; C, hypoxic 3d; D, ischemia+hypoxic 1d; E, ischemia+hypoxic 3d.
Figure 4
Figure 4. The HE staining result of injury of cortex in 21d neonate rat (400×).
A, control group; B, hypoxic group; C, ischemia+hypoxic group.
Figure 5
Figure 5. The HE stains result of injury of hippocampus in 21d neonate rat (400×).
A, control group; B, hypoxic group; C, ischemia+hypoxic group.
Figure 6
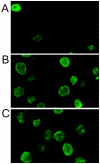
Figure 6. Neural cell apoptosis testing by TUNEL, much more TUNEL positive cells were observed in hypoxic and ischemic+hypoxic group than the controls (400×).
A, control group; B, hypoxic 1d; C, ischemia+hypoxic 1d.
Figure 7
Figure 7. Immunohistochemistry analysis of c-fos expression in the brain of the rats.
A, control (100×); B, control (400×); C, hypoxic 1d (100×); D, hypoxic 1d (400×); E, ischemia+hypoxic 1d (100×); F, ischemia+hypoxic 1d (400×).
Figure 8
Figure 8. The p-ERK levels in the brains tissues from the hypoxic group and the ischemic+hypoxic group were both lower than that in the brains from the controls by immunohistochemistry analysis.
A, control group (400×); B, hypoxic 1d (400×); C, ischemia+hypoxic 1d (400×).

Similar articles

Cited by

References

    1. Shian WJ, Chi CS, Chen JW, Hsieh KS (1994) Hypoxic-ischemic effect on infants and children with cyanotic congenital heart disease: clinical assessment of neurological examination and brain magnetic resonance images. Zhonghua Yi Xue Za Zhi (Taipei) 53: 154-157. PubMed: 8174010. - PubMed
    1. Douglas-Escobar M, Weiss MD (2012) Biomarkers of hypoxic-ischemic encephalopathy in newborns. Front Neurol 3: 144 PubMed: 23130015. - PMC - PubMed
    1. Wallin A, Ohrfelt A, Bjerke M (2012) Characteristic clinical presentation and CSF biomarker pattern in cerebral small vessel disease. J Neurol Sci 322: 192-196. doi:10.1016/j.jns.2012.07.068. PubMed: 22920584. - DOI - PubMed
    1. Kurinczuk JJ, White-Koning M, Badawi N (2010) Epidemiology of neonatal encephalopathy and hypoxic-ischaemic encephalopathy. Early Hum Dev 86: 329-338. doi:10.1016/j.earlhumdev.2010.05.010. PubMed: 20554402. - DOI - PubMed
    1. Triulzi F, Parazzini C, Righini A (2006) Patterns of damage in the mature neonatal brain. Pediatr Radiol 36: 608-620. doi:10.1007/s00247-006-0203-5. PubMed: 16770665. - DOI - PubMed

Publication types

LinkOut - more resources