

Niche-dependent gene expression profile of intratumoral heterogeneous ovarian cancer stem cell populations
- PMID: 24358304
- PMCID: PMC3866276
- DOI: 10.1371/journal.pone.0083651
Niche-dependent gene expression profile of intratumoral heterogeneous ovarian cancer stem cell populations
Abstract
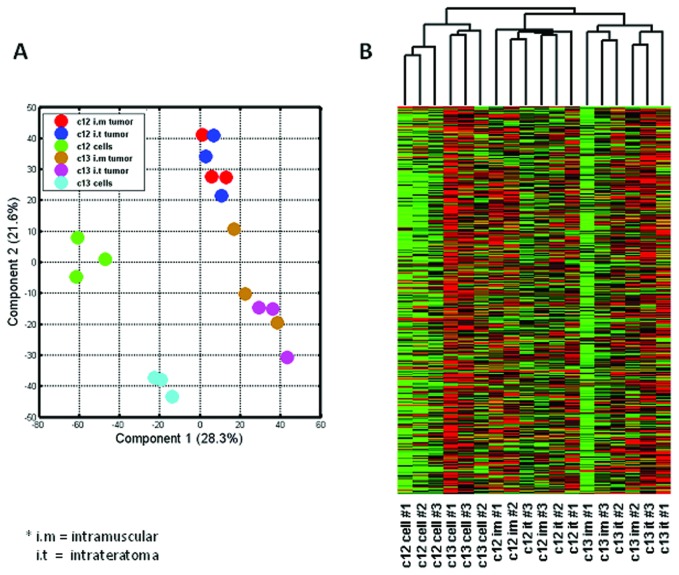
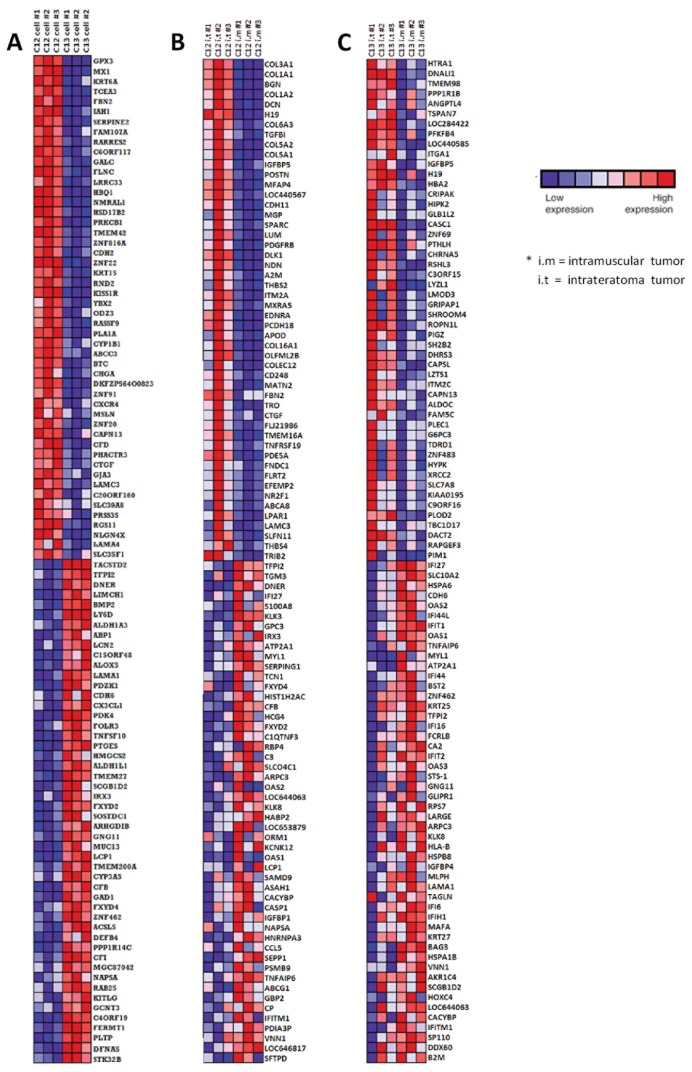
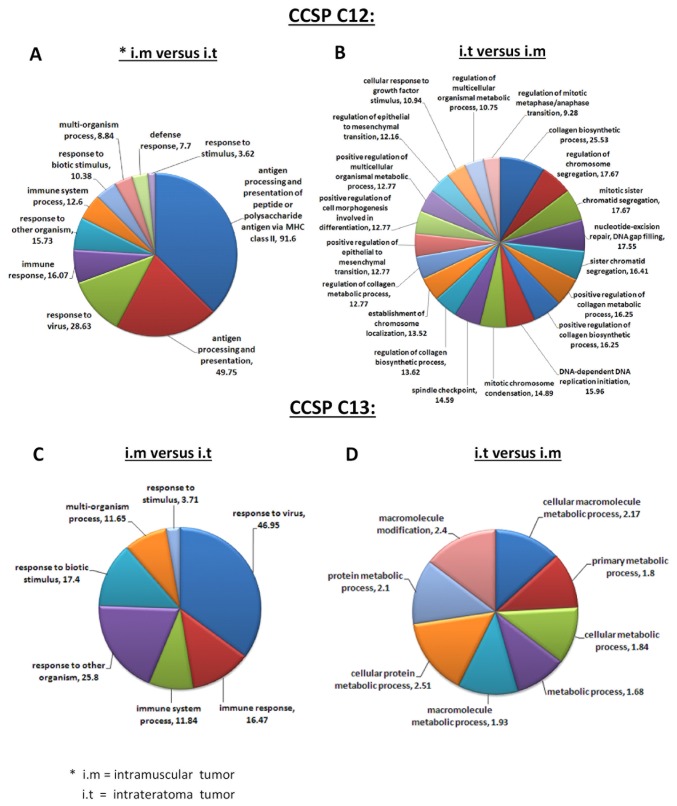
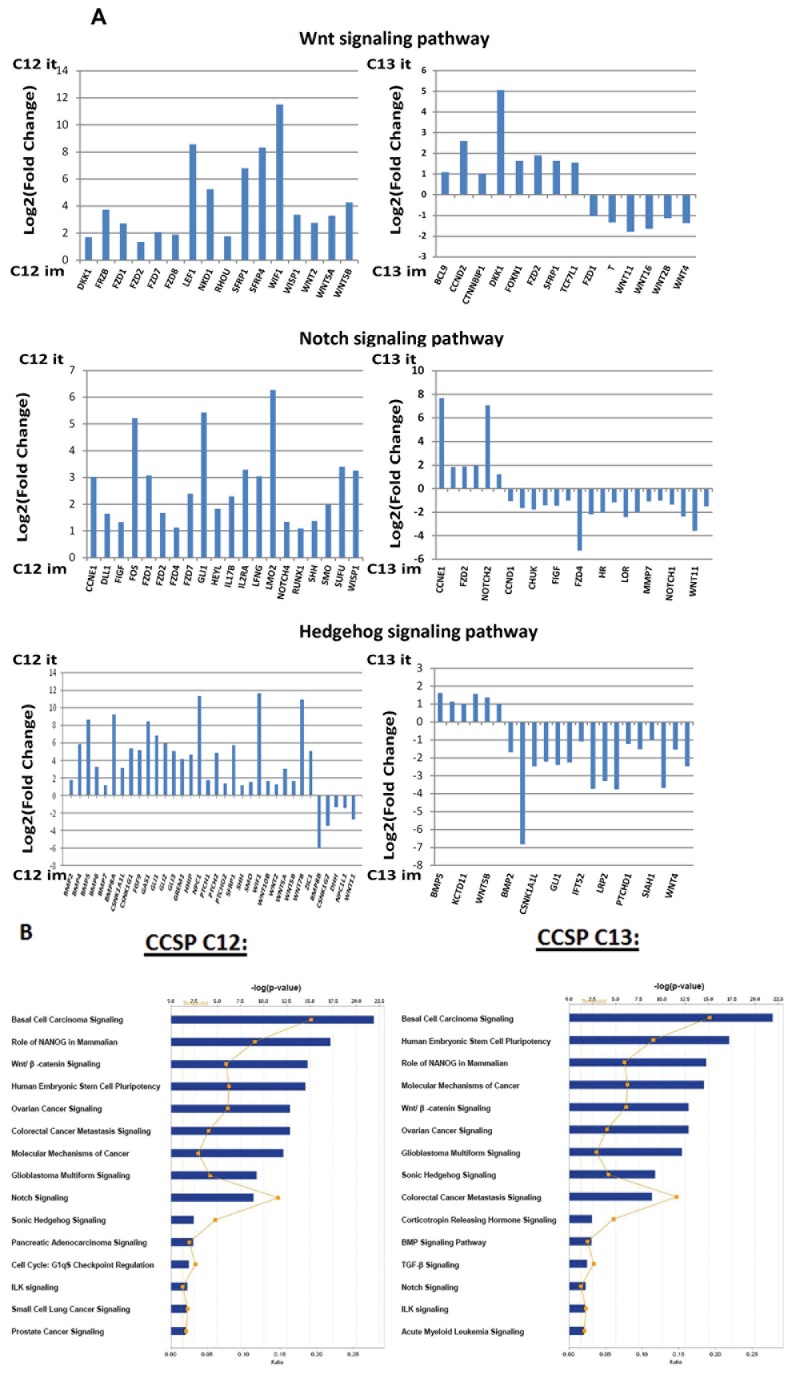
Intratumoral heterogeneity challenges existing paradigms for anti-cancer therapy. We have previously demonstrated that the human embryonic stem cells (hESC)-derived cellular microenvironment in immunocompromised mice, enables functional distinction of heterogeneous tumor cells, including cells which do not grow into a tumor in a conventional direct tumor xenograft platform. We have identified and characterized six cancer cell subpopulations each clonally expanded from a single cell, derived from human ovarian clear cell carcinoma of a single tumor, to demonstrate striking intratumoral phenotypic heterogeneity that is dynamically dependent on the tumor growth microenvironment. These cancer cell subpopulations, characterized as cancer stem cell subpopulations, faithfully recapitulate the full spectrum of histological phenotypic heterogeneity known for human ovarian clear cell carcinoma. Each of the six subpopulations displays a different level of morphologic and tumorigenic differentiation wherein growth in the hESC-derived microenvironment favors growth of CD44+/aldehyde dehydrogenase positive pockets of self-renewing cells that sustain tumor growth through a process of tumorigenic differentiation into CD44-/aldehyde dehydrogenase negative derivatives. Strikingly, these derivative cells display microenvironment-dependent plasticity with the capacity to restore self-renewal markers and CD44 expression. In the current study, we delineate the distinct gene expression and epigenetic profiles of two such subpopulations, representing extremes of phenotypic heterogeneity in terms of niche-dependent self-renewal and tumorigenic differentiation. By combining Gene Set Enrichment, Gene Ontology and Pathway-focused array analyses with methylation status, we propose a suite of robust differences in tumor self-renewal and differentiation pathways that underlie the striking intratumoral phenotypic heterogeneity which characterize this and other solid tumor malignancies.
Conflict of interest statement
Figures

Similar articles
-
Intratumoral heterogeneity in the self-renewal and tumorigenic differentiation of ovarian cancer.Stem Cells. 2012 Mar;30(3):415-24. doi: 10.1002/stem.1029. Stem Cells. 2012. PMID: 22267284
-
Niche-dependent tumorigenic capacity of malignant ovarian ascites-derived cancer cell subpopulations.Clin Cancer Res. 2009 Jan 1;15(1):70-80. doi: 10.1158/1078-0432.CCR-08-1233. Clin Cancer Res. 2009. PMID: 19118034
-
Phenotypic subpopulations of metastatic colon cancer stem cells: genomic analysis.Cancer Genomics Proteomics. 2009 Jan-Feb;6(1):19-29. Cancer Genomics Proteomics. 2009. PMID: 19451087
-
Role of the microenvironment in ovarian cancer stem cell maintenance.Biomed Res Int. 2013;2013:630782. doi: 10.1155/2013/630782. Epub 2012 Dec 24. Biomed Res Int. 2013. PMID: 23484135 Free PMC article. Review.
-
Cancer Stem Cells: Concepts, Challenges, and Opportunities for Cancer Therapy.Methods Mol Biol. 2019;2005:43-66. doi: 10.1007/978-1-4939-9524-0_4. Methods Mol Biol. 2019. PMID: 31175645 Review.
Cited by
-
Proliferation versus regeneration: the good, the bad and the ugly.Front Physiol. 2014 Jan 28;5:10. doi: 10.3389/fphys.2014.00010. eCollection 2014. Front Physiol. 2014. PMID: 24478722 Free PMC article. No abstract available.
-
Molecular changes in endometriosis-associated ovarian clear cell carcinoma.Eur J Cancer. 2015 Sep;51(13):1831-42. doi: 10.1016/j.ejca.2015.05.011. Epub 2015 Jun 6. Eur J Cancer. 2015. PMID: 26059197 Free PMC article.
-
The Role of Intra-Tumoral Heterogeneity and Its Clinical Relevance in Epithelial Ovarian Cancer Recurrence and Metastasis.Cancers (Basel). 2019 Jul 30;11(8):1083. doi: 10.3390/cancers11081083. Cancers (Basel). 2019. PMID: 31366178 Free PMC article. Review.
-
Transcriptomic but not genomic variability confers phenotype of breast cancer stem cells.Cancer Commun (Lond). 2018 Sep 19;38(1):56. doi: 10.1186/s40880-018-0326-8. Cancer Commun (Lond). 2018. PMID: 30231942 Free PMC article.
-
Theranostic barcoded nanoparticles for personalized cancer medicine.Nat Commun. 2016 Nov 10;7:13325. doi: 10.1038/ncomms13325. Nat Commun. 2016. PMID: 27830705 Free PMC article.
References
Publication types
MeSH terms
LinkOut - more resources
Full Text Sources
Other Literature Sources
Medical
Molecular Biology Databases
Miscellaneous
