

Gender differences of brain glucose metabolic networks revealed by FDG-PET: evidence from a large cohort of 400 young adults
- PMID: 24358312
- PMCID: PMC3866135
- DOI: 10.1371/journal.pone.0083821
Gender differences of brain glucose metabolic networks revealed by FDG-PET: evidence from a large cohort of 400 young adults
Abstract
Background: Gender differences of the human brain are an important issue in neuroscience research. In recent years, an increasing amount of evidence has been gathered from noninvasive neuroimaging studies supporting a sexual dimorphism of the human brain. However, there is a lack of imaging studies on gender differences of brain metabolic networks based on a large population sample.
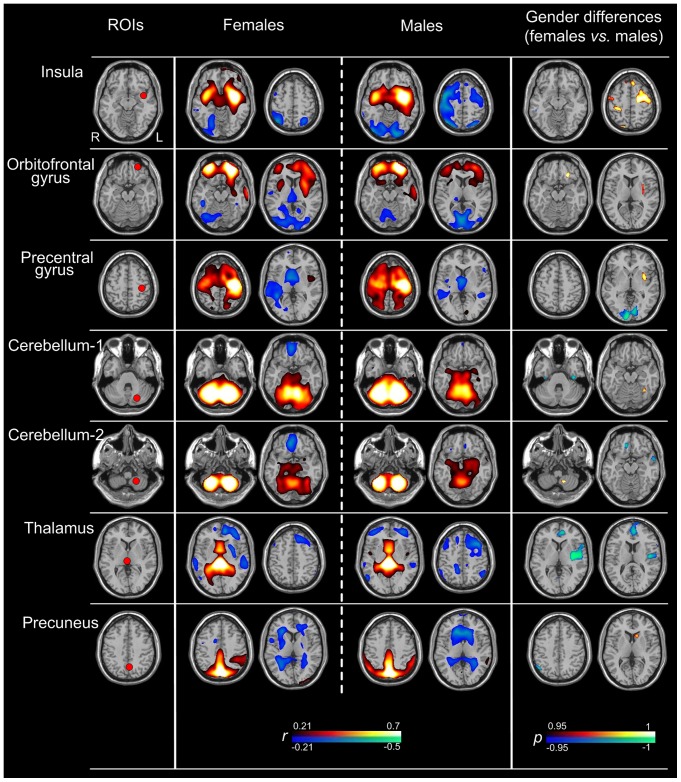
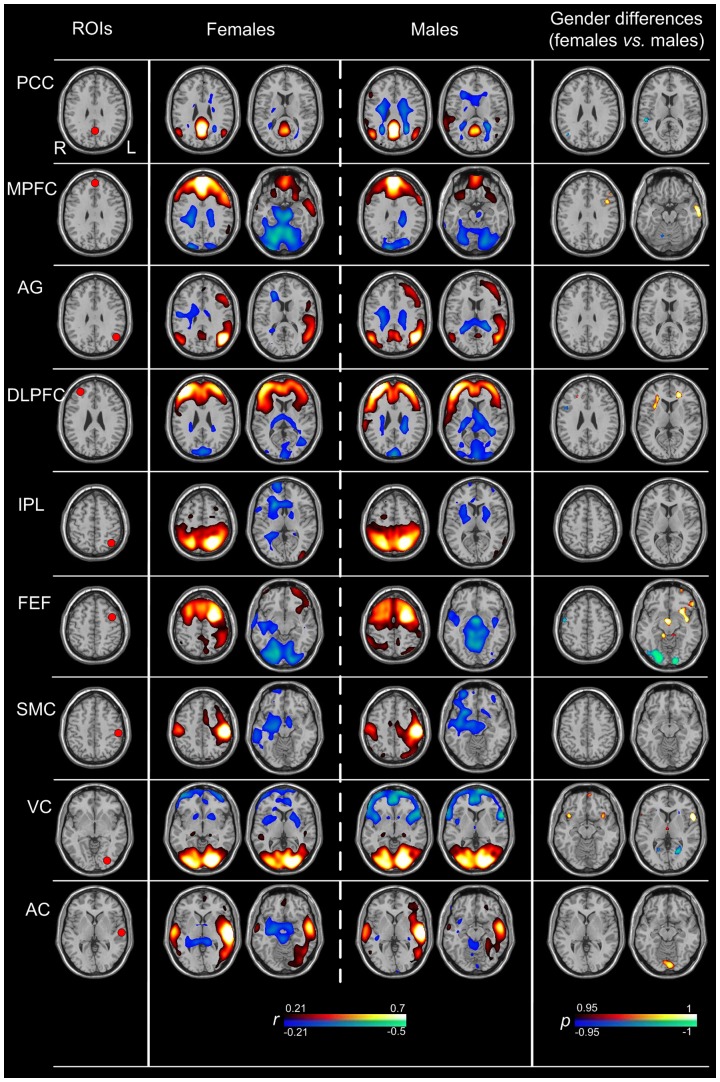
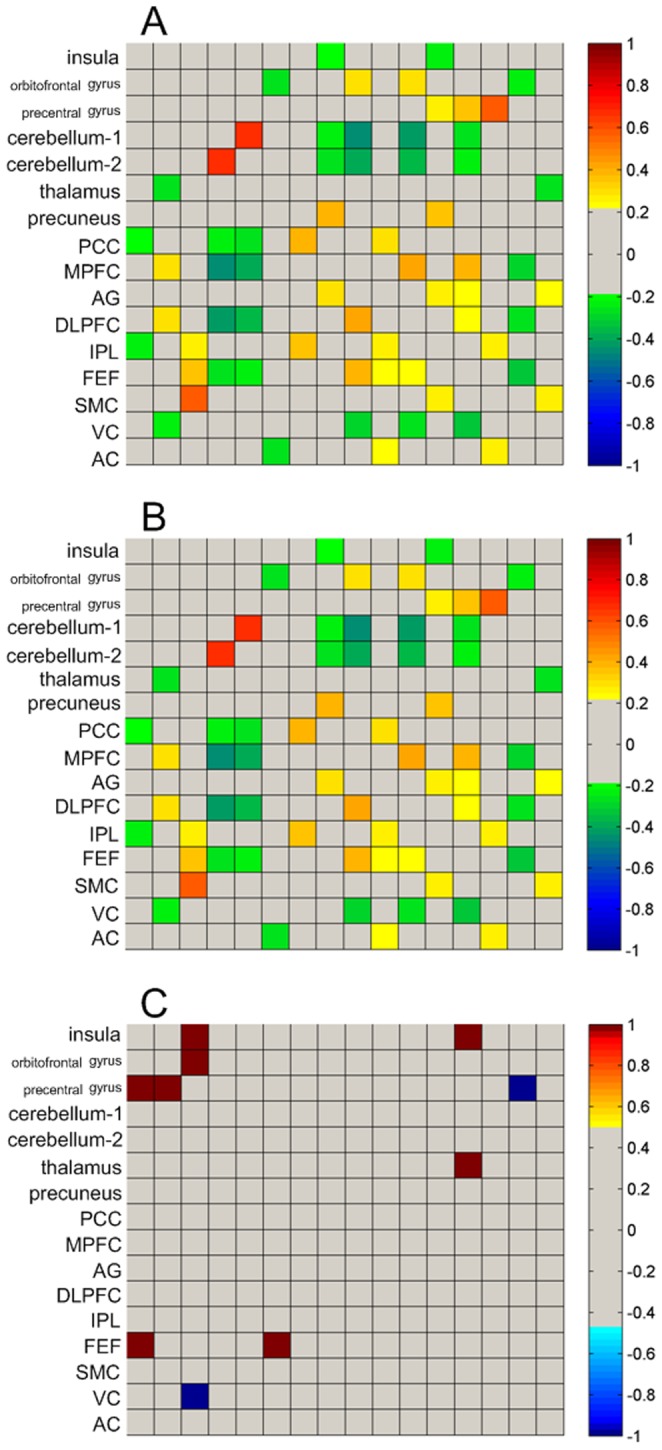
Materials and methods: FDG PET data of 400 right-handed, healthy subjects, including 200 females (age: 25:45 years, mean age ± SD: 40.9 ± 3.9 years) and 200 age-matched males were obtained and analyzed in the present study. We first investigated the regional differences of brain glucose metabolism between genders using a voxel-based two-sample t-test analysis. Subsequently, we investigated the gender differences of the metabolic networks. Sixteen metabolic covariance networks using seed-based correlation were analyzed. Seven regions showing significant regional metabolic differences between genders, and nine regions conventionally used in the resting-state network studies were selected as regions-of-interest. Permutation tests were used for comparing within- and between-network connectivity between genders.
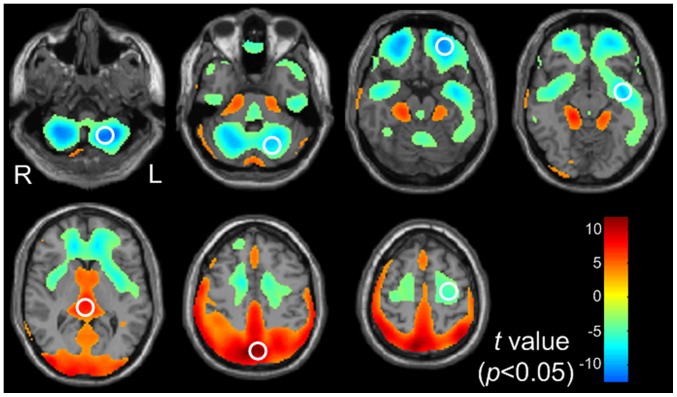
Results: Compared with the males, females showed higher metabolism in the posterior part and lower metabolism in the anterior part of the brain. Moreover, there were widely distributed patterns of the metabolic networks in the human brain. In addition, significant gender differences within and between brain glucose metabolic networks were revealed in the present study.
Conclusion: This study provides solid data that reveal gender differences in regional brain glucose metabolism and brain glucose metabolic networks. These observations might contribute to the better understanding of the gender differences in human brain functions, and suggest that gender should be included as a covariate when designing experiments and explaining results of brain glucose metabolic networks in the control and experimental individuals or patients.
Conflict of interest statement
Figures
Similar articles
-
Small-worldness and gender differences of large scale brain metabolic covariance networks in young adults: a FDG PET study of 400 subjects.Acta Radiol. 2015 Feb;56(2):204-13. doi: 10.1177/0284185114529106. Epub 2014 Apr 24. Acta Radiol. 2015. PMID: 24763919
-
Dynamic brain glucose metabolism identifies anti-correlated cortical-cerebellar networks at rest.J Cereb Blood Flow Metab. 2017 Dec;37(12):3659-3670. doi: 10.1177/0271678X17708692. Epub 2017 May 23. J Cereb Blood Flow Metab. 2017. PMID: 28534658 Free PMC article.
-
Metabolic brain covariant networks as revealed by FDG-PET with reference to resting-state fMRI networks.Brain Connect. 2012;2(5):275-83. doi: 10.1089/brain.2012.0086. Brain Connect. 2012. PMID: 23025619 Free PMC article.
-
Gender differences in healthy aging and Alzheimer's Dementia: A 18 F-FDG-PET study of brain and cognitive reserve.Hum Brain Mapp. 2017 Aug;38(8):4212-4227. doi: 10.1002/hbm.23659. Epub 2017 May 31. Hum Brain Mapp. 2017. PMID: 28561534 Free PMC article.
-
Metabolic connectivity: methods and applications.Curr Opin Neurol. 2017 Dec;30(6):677-685. doi: 10.1097/WCO.0000000000000494. Curr Opin Neurol. 2017. PMID: 28914733 Review.
Cited by
-
Metabolic connectivity as index of verbal working memory.J Cereb Blood Flow Metab. 2015 Jul;35(7):1122-6. doi: 10.1038/jcbfm.2015.40. Epub 2015 Mar 18. J Cereb Blood Flow Metab. 2015. PMID: 25785830 Free PMC article.
-
Sex-related differences in amyotrophic lateral sclerosis: A 2-[18F]FDG-PET study.Eur J Neurol. 2025 Jan;32(1):e16588. doi: 10.1111/ene.16588. Eur J Neurol. 2025. PMID: 39655539 Free PMC article.
-
The Status of the Quality Control in Acupuncture-Neuroimaging Studies.Evid Based Complement Alternat Med. 2016;2016:3685785. doi: 10.1155/2016/3685785. Epub 2016 May 8. Evid Based Complement Alternat Med. 2016. PMID: 27242911 Free PMC article. Review.
-
Characterization of age/sex and the regional distribution of mGluR5 availability in the healthy human brain measured by high-resolution [(11)C]ABP688 PET.Eur J Nucl Med Mol Imaging. 2016 Jan;43(1):152-162. doi: 10.1007/s00259-015-3167-6. Epub 2015 Aug 21. Eur J Nucl Med Mol Imaging. 2016. PMID: 26290423
-
Association between Various Brain Pathologies and Gait Disturbance.Dement Geriatr Cogn Disord. 2017;43(3-4):128-143. doi: 10.1159/000456541. Epub 2017 Feb 3. Dement Geriatr Cogn Disord. 2017. PMID: 28152532 Free PMC article. Review.
References
-
- Filipek PA, Richelme C, Kennedy DN, Caviness VS Jr (1994) The young adult human brain: an MRI-based morphometric analysis. Cereb Cortex 4: 344–360. - PubMed
-
- Allen JS, Damasio H, Grabowski TJ, Bruss J, Zhang W (2003) Sexual dimorphism and asymmetries in the gray-white composition of the human cerebrum. Neuroimage 18: 880–894. - PubMed
-
- Luders E, Narr KL, Thompson PM, Woods RP, Rex DE, et al. (2005) Mapping cortical gray matter in the young adult brain: effects of gender. Neuroimage 26: 493–501. - PubMed
-
- Dai XJ, Gong HH, Wang YX, Zhou FQ, Min YJ, et al. (2012) Gender differences in brain regional homogeneity of healthy subjects after normal sleep and after sleep deprivation: a resting-state fMRI study. Sleep Med 13: 720–727. - PubMed
Publication types
MeSH terms
Substances
LinkOut - more resources
Full Text Sources
Other Literature Sources
